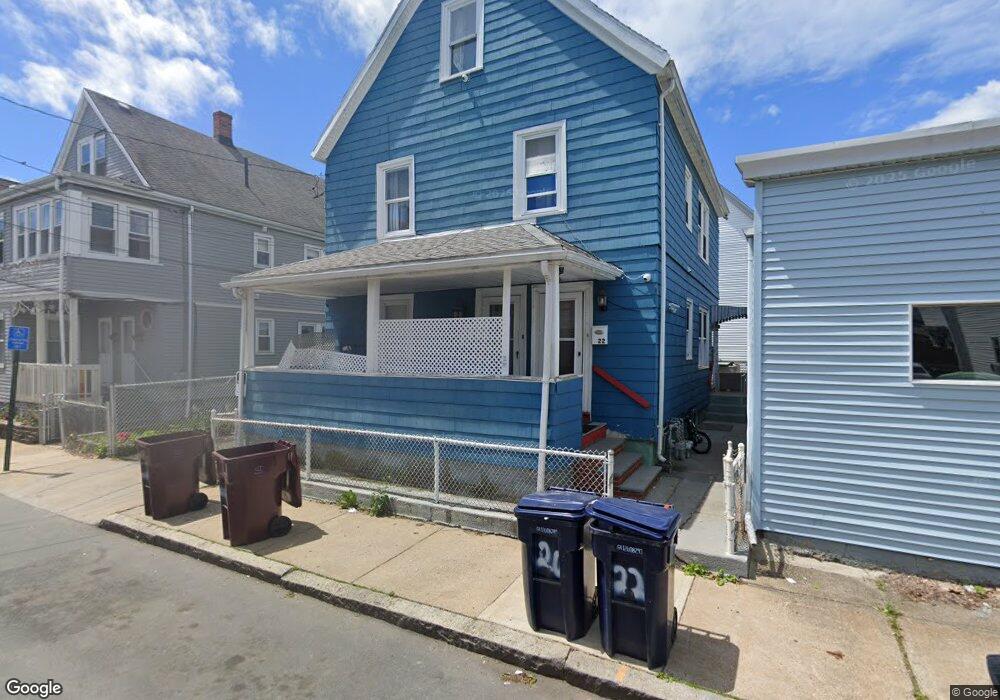
22 Heath St Everett, MA 02149
West Everett NeighborhoodEstimated Value: $688,771 - $777,000
4
Beds
2
Baths
1,728
Sq Ft
$427/Sq Ft
Est. Value
About This Home
This home is located at 22 Heath St, Everett, MA 02149 and is currently estimated at $738,443, approximately $427 per square foot. 22 Heath St is a home located in Middlesex County with nearby schools including Everett High School, Pioneer Charter School of Science, and St Anthony School.
Ownership History
Date
Name
Owned For
Owner Type
Purchase Details
Closed on
Jan 24, 2013
Sold by
Gervasio Mario
Bought by
Haibaoui Kamal and Mejia Luis
Current Estimated Value
Home Financials for this Owner
Home Financials are based on the most recent Mortgage that was taken out on this home.
Original Mortgage
$249,796
Outstanding Balance
$174,298
Interest Rate
3.37%
Mortgage Type
FHA
Estimated Equity
$564,145
Purchase Details
Closed on
Dec 23, 2008
Sold by
Deutsche Bank Natl T C
Bought by
Gervasio Mario
Purchase Details
Closed on
Nov 9, 2007
Sold by
Abdul-Malik Hamid
Bought by
Deutsche Bank Natl T C
Purchase Details
Closed on
Mar 16, 2006
Sold by
Broderick John J and Broderick Lucia
Bought by
Abdul-Malik Hamid
Home Financials for this Owner
Home Financials are based on the most recent Mortgage that was taken out on this home.
Original Mortgage
$403,750
Interest Rate
6.27%
Mortgage Type
Purchase Money Mortgage
Create a Home Valuation Report for This Property
The Home Valuation Report is an in-depth analysis detailing your home's value as well as a comparison with similar homes in the area
Home Values in the Area
Average Home Value in this Area
Purchase History
| Date | Buyer | Sale Price | Title Company |
|---|---|---|---|
| Haibaoui Kamal | $260,000 | -- | |
| Gervasio Mario | $171,000 | -- | |
| Deutsche Bank Natl T C | $372,452 | -- | |
| Abdul-Malik Hamid | $425,000 | -- |
Source: Public Records
Mortgage History
| Date | Status | Borrower | Loan Amount |
|---|---|---|---|
| Open | Haibaoui Kamal | $249,796 | |
| Previous Owner | Abdul-Malik Hamid | $403,750 |
Source: Public Records
Tax History
| Year | Tax Paid | Tax Assessment Tax Assessment Total Assessment is a certain percentage of the fair market value that is determined by local assessors to be the total taxable value of land and additions on the property. | Land | Improvement |
|---|---|---|---|---|
| 2025 | $6,933 | $608,700 | $238,400 | $370,300 |
| 2024 | $6,347 | $553,800 | $211,900 | $341,900 |
| 2023 | $6,207 | $526,900 | $203,100 | $323,800 |
| 2022 | $5,031 | $485,600 | $185,400 | $300,200 |
| 2021 | $4,399 | $445,700 | $156,700 | $289,000 |
| 2020 | $4,639 | $436,000 | $156,700 | $279,300 |
| 2019 | $4,723 | $381,500 | $134,000 | $247,500 |
| 2018 | $4,633 | $336,200 | $116,600 | $219,600 |
| 2017 | $4,264 | $295,300 | $97,100 | $198,200 |
| 2016 | $3,965 | $274,400 | $96,500 | $177,900 |
| 2015 | $3,660 | $250,500 | $83,900 | $166,600 |
Source: Public Records
Map
Nearby Homes
- 19 Heath St
- 39 Montrose St Unit 2
- 9 Carter St
- 43 Charlton St Unit B108
- 39 Parlin St Unit 203
- 34 Paris St
- 24 Corey St Unit 101
- 24 Corey St Unit 201
- 44-46 Cabot St
- 30 Chelsea St Unit 210
- 340 Main St
- 48 Cleveland Ave
- 139 Bucknam St
- 63 Woodville St
- 30 Revere Beach Pkwy Unit 711
- 30 Revere Beach Pkwy Unit 204
- 30 Revere Beach Pkwy Unit 415
- 38 7th St
- 37 Argyle St
- 8 9th St Unit 513
- 20 Heath St
- 24 Heath St
- 16 Heath St
- 21 May St
- 17 May St
- 15/17 May St
- 23 May St
- 23 May St Unit 1
- 15 Heath St
- 12 Heath St
- 12 Heath St Unit 1
- 23 Heath St
- 13 Heath St
- 13 Heath St Unit 1
- 11 May St
- 56 Wellington Ave
- 56 Wellington Ave Unit 1
- 56 Wellington Ave Unit 2
- 58 Wellington Ave Unit 2
- 58 Wellington Ave
Your Personal Tour Guide
Ask me questions while you tour the home.