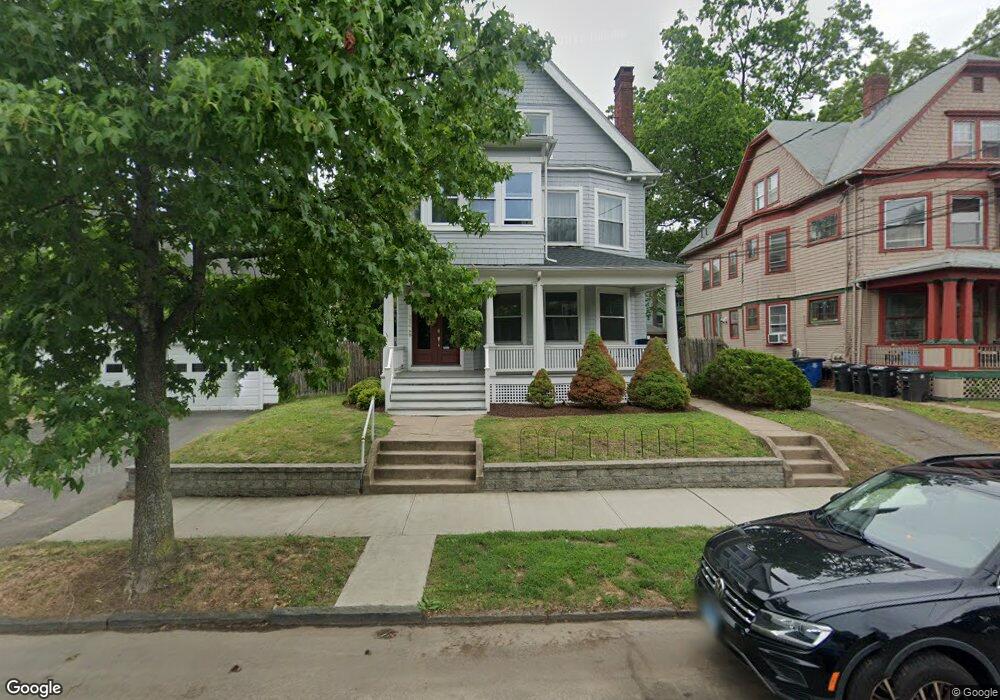
22 Hubinger St New Haven, CT 06511
Edgewood NeighborhoodEstimated Value: $483,000 - $659,000
6
Beds
3
Baths
3,471
Sq Ft
$165/Sq Ft
Est. Value
About This Home
This home is located at 22 Hubinger St, New Haven, CT 06511 and is currently estimated at $572,333, approximately $164 per square foot. 22 Hubinger St is a home located in New Haven County with nearby schools including Edgewood Creative Thinking through STEAM Magnet School, Elm City Montessori School, and Hopkins School.
Ownership History
Date
Name
Owned For
Owner Type
Purchase Details
Closed on
Oct 24, 2019
Sold by
Scoopo Linda
Bought by
City Restorations Llc
Current Estimated Value
Home Financials for this Owner
Home Financials are based on the most recent Mortgage that was taken out on this home.
Original Mortgage
$345,159
Outstanding Balance
$301,006
Interest Rate
3.6%
Mortgage Type
New Conventional
Estimated Equity
$271,327
Purchase Details
Closed on
Nov 27, 2018
Sold by
Scoopo Thomas
Bought by
Scoopo Thomas
Purchase Details
Closed on
Mar 29, 2016
Sold by
Scoopo Scott
Bought by
Scoopo Thomas
Purchase Details
Closed on
Jan 17, 2012
Sold by
Scoopo Linda and Scoopo Thomas
Bought by
Scoopo Scott
Purchase Details
Closed on
Aug 4, 1994
Sold by
Russell Susan A
Bought by
Scoopo Thomas J and Scoopo Linda
Home Financials for this Owner
Home Financials are based on the most recent Mortgage that was taken out on this home.
Original Mortgage
$116,462
Interest Rate
8.4%
Mortgage Type
Unknown
Create a Home Valuation Report for This Property
The Home Valuation Report is an in-depth analysis detailing your home's value as well as a comparison with similar homes in the area
Home Values in the Area
Average Home Value in this Area
Purchase History
| Date | Buyer | Sale Price | Title Company |
|---|---|---|---|
| City Restorations Llc | $231,000 | -- | |
| Scoopo Thomas | -- | -- | |
| Scoopo Thomas | -- | -- | |
| Scoopo Scott | -- | -- | |
| Scoopo Thomas J | $118,000 | -- |
Source: Public Records
Mortgage History
| Date | Status | Borrower | Loan Amount |
|---|---|---|---|
| Open | City Restorations Llc | $345,159 | |
| Previous Owner | Scoopo Thomas J | $116,462 |
Source: Public Records
Tax History
| Year | Tax Paid | Tax Assessment Tax Assessment Total Assessment is a certain percentage of the fair market value that is determined by local assessors to be the total taxable value of land and additions on the property. | Land | Improvement |
|---|---|---|---|---|
| 2025 | $8,740 | $221,830 | $47,600 | $174,230 |
| 2024 | $8,540 | $221,830 | $47,600 | $174,230 |
| 2023 | $8,252 | $221,830 | $47,600 | $174,230 |
| 2022 | $8,818 | $221,830 | $47,600 | $174,230 |
| 2021 | $6,414 | $146,160 | $41,020 | $105,140 |
| 2020 | $6,414 | $146,160 | $41,020 | $105,140 |
| 2019 | $6,282 | $146,160 | $41,020 | $105,140 |
| 2018 | $6,282 | $146,160 | $41,020 | $105,140 |
| 2017 | $5,653 | $146,160 | $41,020 | $105,140 |
| 2016 | $4,857 | $116,900 | $32,270 | $84,630 |
| 2015 | $4,857 | $116,900 | $32,270 | $84,630 |
| 2014 | $4,857 | $116,900 | $32,270 | $84,630 |
Source: Public Records
Map
Nearby Homes
- 22 Hubinger St Unit 3
- 22 Hubinger St Unit 2
- 22 Hubinger St Unit 1
- 28 Hubinger St
- 32 Hubinger St
- 32 Hubinger St Unit 2
- 32 Hubinger St Unit 3
- 32 Hubinger St Unit 1
- 95 W Park Ave
- 107 W Park Ave
- 115 W Park Ave
- 38 Hubinger St
- 38 Hubinger St Unit 2
- 38 Hubinger St Unit 1
- 40 Hubinger St Unit 2
- 23 Hubinger St
- 119 W Park Ave
- 27 Hubinger St
- 27 Hubinger St Unit 2
- 27 Hubinger St Unit 1
Your Personal Tour Guide
Ask me questions while you tour the home.