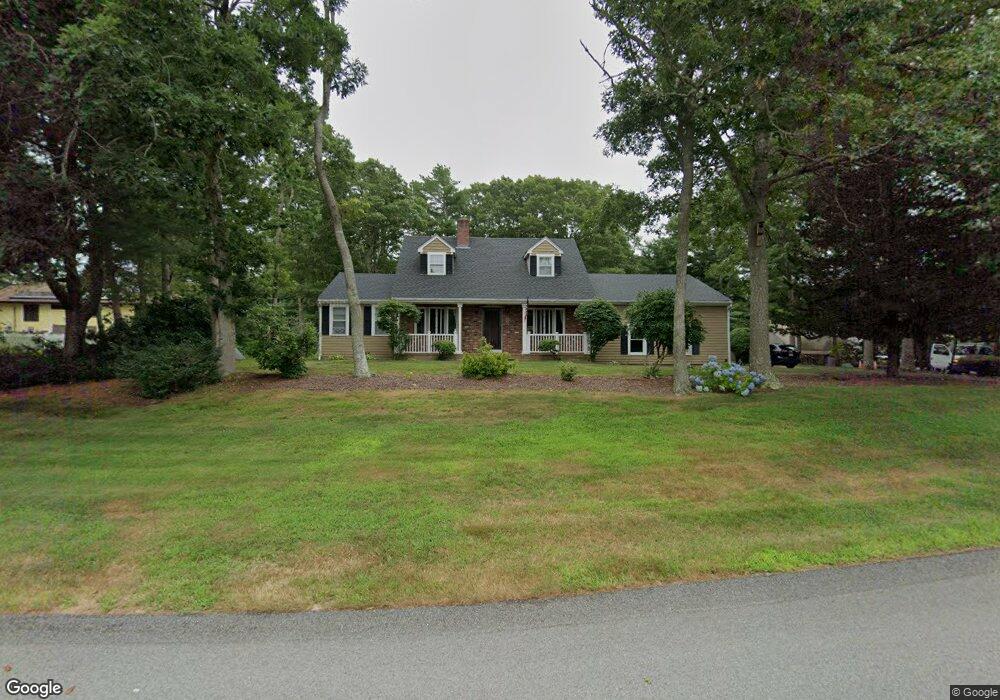
22 Keith Rd Pocasset, MA 02559
Pocasset NeighborhoodEstimated Value: $691,000 - $798,000
3
Beds
3
Baths
2,095
Sq Ft
$360/Sq Ft
Est. Value
About This Home
This home is located at 22 Keith Rd, Pocasset, MA 02559 and is currently estimated at $754,485, approximately $360 per square foot. 22 Keith Rd is a home located in Barnstable County with nearby schools including Bourne High School and Cadence Academy Preschool - Bourne.
Ownership History
Date
Name
Owned For
Owner Type
Purchase Details
Closed on
Mar 12, 2008
Sold by
Roux Jane F and Roux Lorne F
Bought by
Roux Diane M and Roux Michael J
Current Estimated Value
Home Financials for this Owner
Home Financials are based on the most recent Mortgage that was taken out on this home.
Original Mortgage
$305,600
Interest Rate
5.72%
Mortgage Type
Purchase Money Mortgage
Purchase Details
Closed on
Sep 18, 2006
Sold by
Shatas Judith A and Roux Lorne F
Bought by
Roux Jane F and Roux Lorne F
Create a Home Valuation Report for This Property
The Home Valuation Report is an in-depth analysis detailing your home's value as well as a comparison with similar homes in the area
Home Values in the Area
Average Home Value in this Area
Purchase History
| Date | Buyer | Sale Price | Title Company |
|---|---|---|---|
| Roux Diane M | $382,000 | -- | |
| Roux Diane M | $382,000 | -- | |
| Roux Jane F | -- | -- | |
| Roux Jane F | -- | -- | |
| Roux Jane F | -- | -- |
Source: Public Records
Mortgage History
| Date | Status | Borrower | Loan Amount |
|---|---|---|---|
| Open | Roux Jane F | $283,000 | |
| Closed | Roux Jane F | $25,000 | |
| Closed | Roux Diane M | $305,600 |
Source: Public Records
Tax History Compared to Growth
Tax History
| Year | Tax Paid | Tax Assessment Tax Assessment Total Assessment is a certain percentage of the fair market value that is determined by local assessors to be the total taxable value of land and additions on the property. | Land | Improvement |
|---|---|---|---|---|
| 2025 | $5,311 | $680,000 | $237,100 | $442,900 |
| 2024 | $5,113 | $637,500 | $225,800 | $411,700 |
| 2023 | $4,894 | $555,500 | $191,200 | $364,300 |
| 2022 | $5,013 | $496,800 | $207,600 | $289,200 |
| 2021 | $4,870 | $452,200 | $189,000 | $263,200 |
| 2020 | $4,605 | $428,800 | $187,200 | $241,600 |
| 2019 | $4,364 | $415,200 | $187,200 | $228,000 |
| 2018 | $4,169 | $395,500 | $178,300 | $217,200 |
| 2017 | $3,927 | $381,300 | $163,500 | $217,800 |
| 2016 | $3,769 | $371,000 | $163,500 | $207,500 |
| 2015 | $3,736 | $371,000 | $163,500 | $207,500 |
Source: Public Records
Map
Nearby Homes