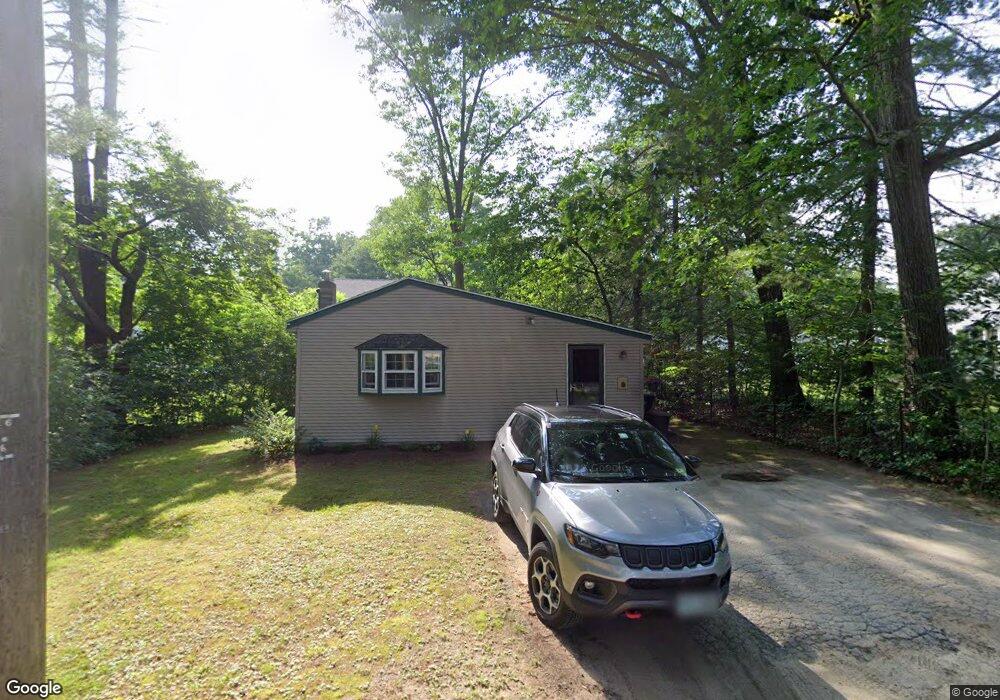
22 King St Salem, NH 03079
Arlington Pond NeighborhoodEstimated Value: $336,739 - $394,000
1
Bed
1
Bath
816
Sq Ft
$456/Sq Ft
Est. Value
About This Home
This home is located at 22 King St, Salem, NH 03079 and is currently estimated at $372,185, approximately $456 per square foot. 22 King St is a home located in Rockingham County with nearby schools including North Salem Elementary School, Woodbury School, and Salem High School.
Ownership History
Date
Name
Owned For
Owner Type
Purchase Details
Closed on
May 14, 2004
Sold by
Beeler Thomas T and Beeler Susan J
Bought by
Desmarais Jennifer and Desmarais Michael
Current Estimated Value
Home Financials for this Owner
Home Financials are based on the most recent Mortgage that was taken out on this home.
Original Mortgage
$275,000
Outstanding Balance
$128,664
Interest Rate
5.47%
Mortgage Type
Purchase Money Mortgage
Estimated Equity
$243,521
Purchase Details
Closed on
Apr 22, 1988
Bought by
Hopkins Jill F
Create a Home Valuation Report for This Property
The Home Valuation Report is an in-depth analysis detailing your home's value as well as a comparison with similar homes in the area
Home Values in the Area
Average Home Value in this Area
Purchase History
| Date | Buyer | Sale Price | Title Company |
|---|---|---|---|
| Desmarais Jennifer | $855,000 | -- | |
| Hopkins Jill F | -- | -- |
Source: Public Records
Mortgage History
| Date | Status | Borrower | Loan Amount |
|---|---|---|---|
| Open | Hopkins Jill F | $275,000 |
Source: Public Records
Tax History Compared to Growth
Tax History
| Year | Tax Paid | Tax Assessment Tax Assessment Total Assessment is a certain percentage of the fair market value that is determined by local assessors to be the total taxable value of land and additions on the property. | Land | Improvement |
|---|---|---|---|---|
| 2024 | $3,340 | $189,800 | $115,300 | $74,500 |
| 2023 | $3,219 | $189,800 | $115,300 | $74,500 |
| 2022 | $3,046 | $189,800 | $115,300 | $74,500 |
| 2021 | $3,033 | $189,800 | $115,300 | $74,500 |
| 2020 | $3,103 | $140,900 | $82,300 | $58,600 |
| 2019 | $3,097 | $140,900 | $82,300 | $58,600 |
| 2018 | $3,045 | $140,900 | $82,300 | $58,600 |
| 2017 | $2,936 | $140,900 | $82,300 | $58,600 |
| 2016 | $2,879 | $140,900 | $82,300 | $58,600 |
| 2015 | $2,879 | $134,600 | $86,300 | $48,300 |
| 2014 | $2,798 | $134,600 | $86,300 | $48,300 |
| 2013 | $2,754 | $134,600 | $86,300 | $48,300 |
Source: Public Records
Map
Nearby Homes