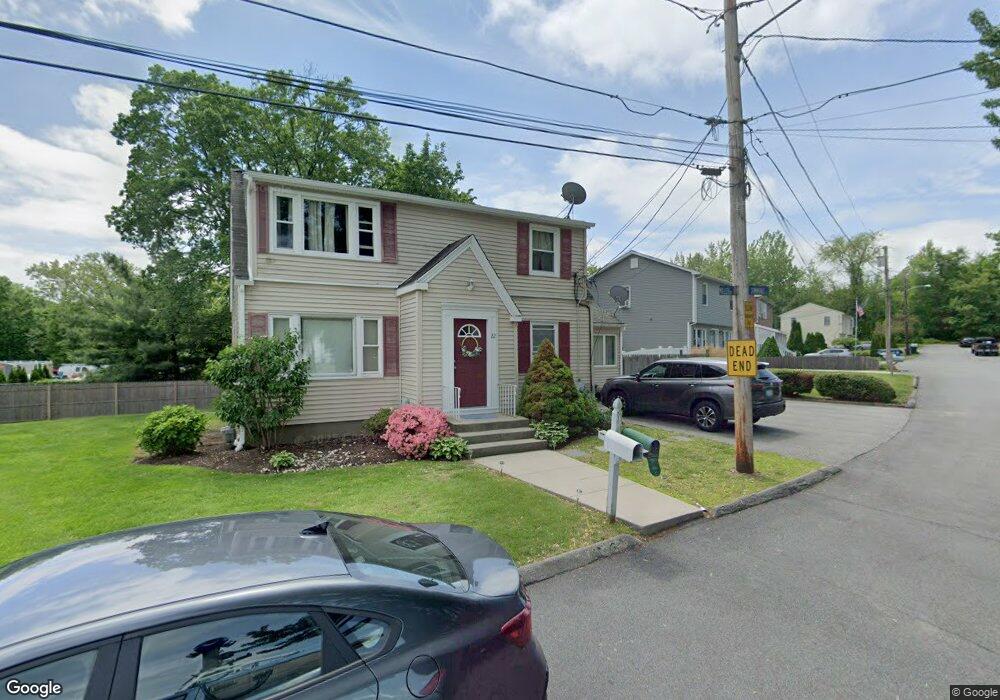
22 Miller Cir Johnston, RI 02919
Thornton NeighborhoodEstimated Value: $403,919 - $483,000
5
Beds
2
Baths
1,914
Sq Ft
$237/Sq Ft
Est. Value
About This Home
This home is located at 22 Miller Cir, Johnston, RI 02919 and is currently estimated at $452,980, approximately $236 per square foot. 22 Miller Cir is a home located in Providence County with nearby schools including Mazomanie Elementary School, Johnston Senior High School, and St Rocco School.
Ownership History
Date
Name
Owned For
Owner Type
Purchase Details
Closed on
Jun 30, 2008
Sold by
Us Bank Na
Bought by
Tusup Marjan and Abatecola Linda
Current Estimated Value
Purchase Details
Closed on
Oct 30, 2002
Sold by
Cantelo Mindi L and Sadak James J
Bought by
Laurence Linda
Purchase Details
Closed on
Aug 23, 1999
Sold by
Mollicone Maria
Bought by
Cantelo Mindi L and Sadak James J
Create a Home Valuation Report for This Property
The Home Valuation Report is an in-depth analysis detailing your home's value as well as a comparison with similar homes in the area
Home Values in the Area
Average Home Value in this Area
Purchase History
| Date | Buyer | Sale Price | Title Company |
|---|---|---|---|
| Tusup Marjan | $157,000 | -- | |
| Tusup Marjan | $157,000 | -- | |
| Laurence Linda | $183,000 | -- | |
| Laurence Linda | $183,000 | -- | |
| Cantelo Mindi L | $116,000 | -- | |
| Cantelo Mindi L | $116,000 | -- |
Source: Public Records
Mortgage History
| Date | Status | Borrower | Loan Amount |
|---|---|---|---|
| Open | Cantelo Mindi L | $141,240 | |
| Closed | Cantelo Mindi L | $157,500 |
Source: Public Records
Tax History Compared to Growth
Tax History
| Year | Tax Paid | Tax Assessment Tax Assessment Total Assessment is a certain percentage of the fair market value that is determined by local assessors to be the total taxable value of land and additions on the property. | Land | Improvement |
|---|---|---|---|---|
| 2025 | $4,877 | $312,200 | $87,200 | $225,000 |
| 2024 | $4,777 | $312,200 | $87,200 | $225,000 |
| 2023 | $4,777 | $312,200 | $87,200 | $225,000 |
| 2022 | $4,371 | $188,100 | $67,000 | $121,100 |
| 2021 | $4,371 | $188,100 | $67,000 | $121,100 |
| 2018 | $4,093 | $148,900 | $52,600 | $96,300 |
| 2016 | $5,415 | $148,900 | $52,600 | $96,300 |
| 2015 | $4,027 | $138,900 | $55,000 | $83,900 |
| 2014 | $3,993 | $138,900 | $55,000 | $83,900 |
| 2013 | $3,993 | $138,900 | $55,000 | $83,900 |
Source: Public Records
Map
Nearby Homes