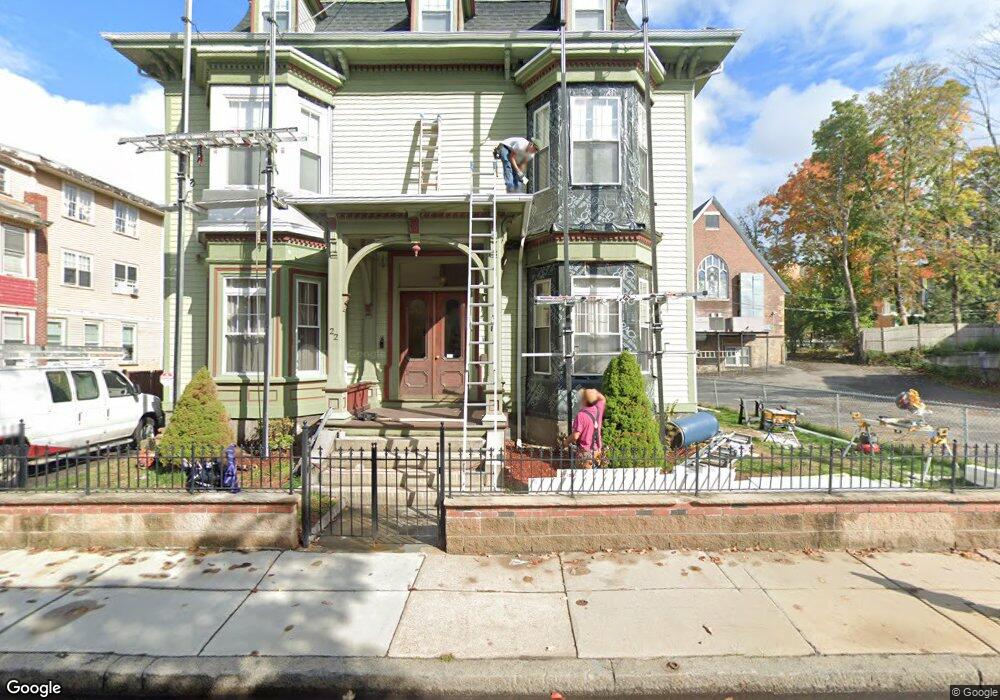
22 Moreland St Unit 1 Roxbury, MA 02119
Sav-Mor NeighborhoodEstimated Value: $687,000 - $792,000
3
Beds
2
Baths
1,854
Sq Ft
$388/Sq Ft
Est. Value
About This Home
This home is located at 22 Moreland St Unit 1, Roxbury, MA 02119 and is currently estimated at $718,795, approximately $387 per square foot. 22 Moreland St Unit 1 is a home located in Suffolk County with nearby schools including Dudley Street Neighborhood Charter School and City on a Hill Charter Public School.
Ownership History
Date
Name
Owned For
Owner Type
Purchase Details
Closed on
Mar 10, 2010
Sold by
Williams Glenroy O
Bought by
Rush Ingrid
Current Estimated Value
Home Financials for this Owner
Home Financials are based on the most recent Mortgage that was taken out on this home.
Original Mortgage
$288,000
Outstanding Balance
$191,262
Interest Rate
5.02%
Mortgage Type
Purchase Money Mortgage
Estimated Equity
$527,534
Create a Home Valuation Report for This Property
The Home Valuation Report is an in-depth analysis detailing your home's value as well as a comparison with similar homes in the area
Home Values in the Area
Average Home Value in this Area
Purchase History
| Date | Buyer | Sale Price | Title Company |
|---|---|---|---|
| Rush Ingrid | $288,000 | -- | |
| Rush Ingrid | $288,000 | -- |
Source: Public Records
Mortgage History
| Date | Status | Borrower | Loan Amount |
|---|---|---|---|
| Open | Rush Ingrid | $288,000 | |
| Closed | Rush Ingrid | $288,000 |
Source: Public Records
Tax History Compared to Growth
Tax History
| Year | Tax Paid | Tax Assessment Tax Assessment Total Assessment is a certain percentage of the fair market value that is determined by local assessors to be the total taxable value of land and additions on the property. | Land | Improvement |
|---|---|---|---|---|
| 2025 | $7,829 | $676,100 | $0 | $676,100 |
| 2024 | $6,887 | $631,800 | $0 | $631,800 |
| 2023 | $6,523 | $607,400 | $0 | $607,400 |
| 2022 | $6,294 | $578,500 | $0 | $578,500 |
| 2021 | $6,052 | $567,200 | $0 | $567,200 |
| 2020 | $5,673 | $537,200 | $0 | $537,200 |
| 2019 | $5,148 | $488,400 | $0 | $488,400 |
| 2018 | $4,651 | $443,800 | $0 | $443,800 |
| 2017 | $4,392 | $414,700 | $0 | $414,700 |
| 2016 | $4,264 | $387,600 | $0 | $387,600 |
| 2015 | $3,536 | $292,000 | $0 | $292,000 |
| 2014 | $3,210 | $255,200 | $0 | $255,200 |
Source: Public Records
Map
Nearby Homes
- 20 Rockville Park
- 22 Rockville Park
- 37 Regent St Unit 2
- 51 Saint James St
- 91 Zeigler St
- 250 Dudley St Unit 1
- 2 Mount Pleasant Place Unit 2
- 101 Mount Pleasant Ave
- 10 Taber St Unit 501
- 30 Copeland St Unit 1
- 33 Copeland Park Unit C
- 108 Mount Pleasant Ave Unit 108R
- 10 Rockland St Unit 4
- 7 Langford Park Unit 3
- 38 Juniper St
- 59 Perrin St
- 59 Perrin St Unit 1
- 94 Walnut Ave
- 9 W Cedar St Unit 1
- 2149 Washington St Unit 604
- 22 Moreland St Unit 3
- 22 Moreland St Unit 2
- 22 Moreland St
- 18 Moreland St Unit 20
- 18 Moreland St Unit 2
- 20 Moreland St Unit 1
- 20 Moreland St Unit 2
- 16 Moreland St
- 27 Winthrop St Unit 2
- 27 Winthrop St Unit 1
- 27 Winthrop St
- 27 Winthrop St Unit 3
- 24 Moreland St Unit 26
- 14 Moreland St
- 19 Winthrop St
- 23 Moreland St Unit 2B
- 23 Moreland St Unit 2
- 23 Moreland St
- 23 Moreland St Unit 1
- 17 Winthrop St