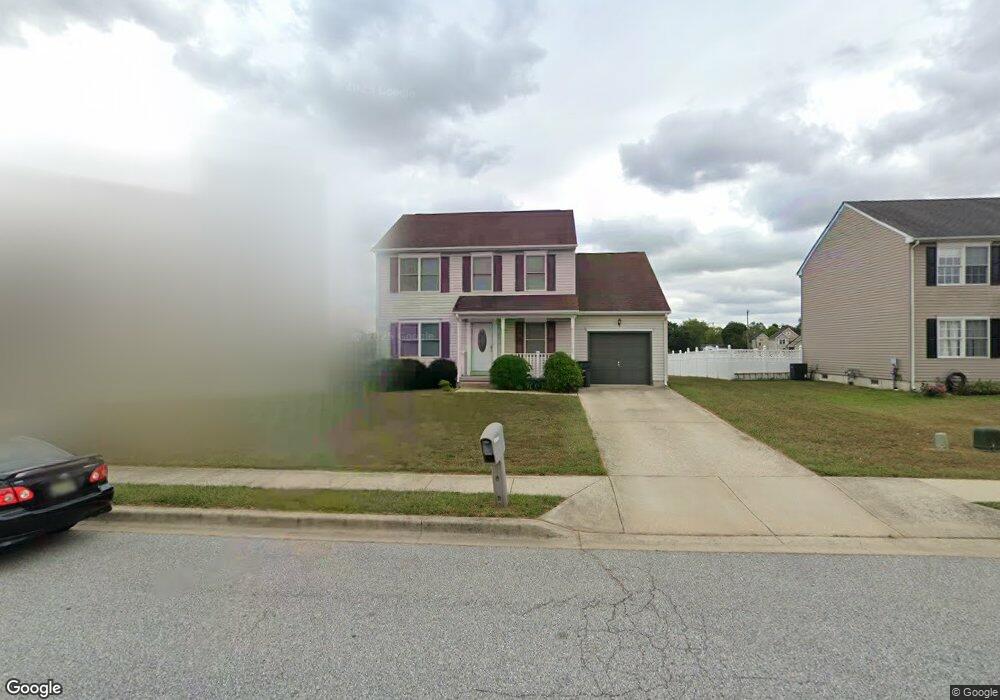
22 Nugent Loop Smyrna, DE 19977
Estimated Value: $364,451 - $408,000
3
Beds
3
Baths
1,865
Sq Ft
$205/Sq Ft
Est. Value
About This Home
This home is located at 22 Nugent Loop, Smyrna, DE 19977 and is currently estimated at $382,113, approximately $204 per square foot. 22 Nugent Loop is a home located in Kent County with nearby schools including Clayton Elementary School, John Bassett Moore Intermediate School, and Smyrna Middle School.
Ownership History
Date
Name
Owned For
Owner Type
Purchase Details
Closed on
Feb 10, 2016
Sold by
Watson Vernon N and Watson Deborah Bass
Bought by
Watson Vernon N
Current Estimated Value
Purchase Details
Closed on
Oct 20, 2005
Sold by
Town And Country Farm Llc
Bought by
Watson Vernon N and Watson Deborah C
Home Financials for this Owner
Home Financials are based on the most recent Mortgage that was taken out on this home.
Original Mortgage
$49,280
Outstanding Balance
$26,526
Interest Rate
5.85%
Mortgage Type
Seller Take Back
Estimated Equity
$355,587
Create a Home Valuation Report for This Property
The Home Valuation Report is an in-depth analysis detailing your home's value as well as a comparison with similar homes in the area
Home Values in the Area
Average Home Value in this Area
Purchase History
| Date | Buyer | Sale Price | Title Company |
|---|---|---|---|
| Watson Vernon N | -- | None Available | |
| Watson Vernon N | $246,520 | None Available |
Source: Public Records
Mortgage History
| Date | Status | Borrower | Loan Amount |
|---|---|---|---|
| Open | Watson Vernon N | $49,280 |
Source: Public Records
Tax History
| Year | Tax Paid | Tax Assessment Tax Assessment Total Assessment is a certain percentage of the fair market value that is determined by local assessors to be the total taxable value of land and additions on the property. | Land | Improvement |
|---|---|---|---|---|
| 2025 | $1,497 | $357,000 | $74,900 | $282,100 |
| 2024 | $1,506 | $357,000 | $74,900 | $282,100 |
| 2023 | $1,469 | $55,300 | $10,100 | $45,200 |
| 2022 | $1,401 | $55,300 | $10,100 | $45,200 |
| 2021 | $1,373 | $55,300 | $10,100 | $45,200 |
| 2020 | $1,200 | $55,300 | $10,100 | $45,200 |
| 2019 | $1,211 | $55,300 | $10,100 | $45,200 |
| 2018 | $1,212 | $55,300 | $10,100 | $45,200 |
| 2017 | $1,208 | $55,300 | $0 | $0 |
| 2016 | $1,225 | $55,300 | $0 | $0 |
| 2015 | $1,230 | $55,300 | $0 | $0 |
| 2014 | $1,151 | $55,300 | $0 | $0 |
Source: Public Records
Map
Nearby Homes
Your Personal Tour Guide
Ask me questions while you tour the home.