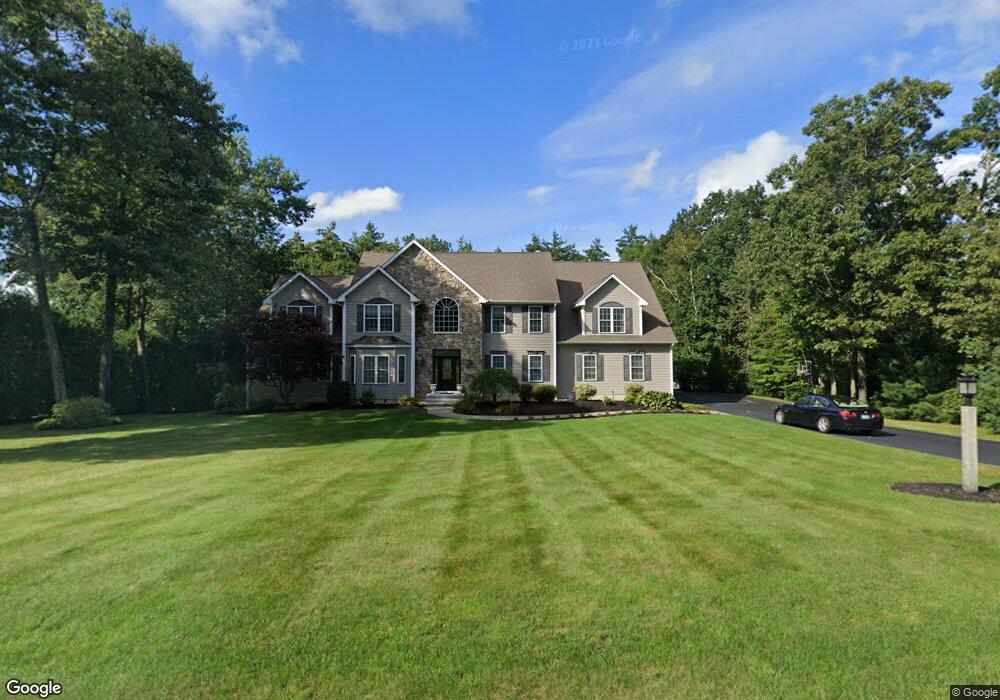
22 Post Rd Hooksett, NH 03106
Estimated Value: $1,018,000 - $1,264,000
6
Beds
6
Baths
3,878
Sq Ft
$282/Sq Ft
Est. Value
About This Home
This home is located at 22 Post Rd, Hooksett, NH 03106 and is currently estimated at $1,094,868, approximately $282 per square foot. 22 Post Rd is a home located in Merrimack County with nearby schools including Fred C. Underhill School, Hooksett Memorial School, and David R. Cawley Middle School.
Create a Home Valuation Report for This Property
The Home Valuation Report is an in-depth analysis detailing your home's value as well as a comparison with similar homes in the area
Home Values in the Area
Average Home Value in this Area
Tax History
| Year | Tax Paid | Tax Assessment Tax Assessment Total Assessment is a certain percentage of the fair market value that is determined by local assessors to be the total taxable value of land and additions on the property. | Land | Improvement |
|---|---|---|---|---|
| 2024 | $19,078 | $1,124,900 | $186,100 | $938,800 |
| 2023 | $17,976 | $1,124,900 | $185,200 | $939,700 |
| 2022 | $15,753 | $655,000 | $126,600 | $528,400 |
| 2021 | $14,554 | $655,000 | $126,600 | $528,400 |
| 2020 | $14,744 | $655,000 | $126,600 | $528,400 |
| 2019 | $14,115 | $655,000 | $126,600 | $528,400 |
| 2018 | $14,125 | $655,000 | $126,600 | $528,400 |
| 2017 | $13,651 | $510,500 | $107,000 | $403,500 |
| 2016 | $4,640 | $510,500 | $107,000 | $403,500 |
| 2015 | $3,587 | $510,500 | $107,000 | $403,500 |
| 2014 | $3,252 | $510,500 | $107,000 | $403,500 |
| 2013 | -- | $510,500 | $107,000 | $403,500 |
Source: Public Records
Map
Nearby Homes
- 59 Post Rd
- 1821 Hooksett Rd
- 12 Chase St
- 8 Short Ave
- 131 Merrimack St
- 117 Merrimack St
- 0 Chester Turnpike Unit 18
- 8 Park St
- 1601 Hooksett Rd
- 15 Sullivan Dr
- 26 Parkwood Dr
- 2 Brandywine Dr
- 7 Oak St
- 19 Sullivan Dr
- 0 Granite St Unit 48
- 422 Dawn Dr Unit 23
- 427 Dawn Dr Unit 15
- 1465 Hooksett Rd Unit 418
- 1465 Hooksett Rd Unit 183
- 1465 Hooksett Rd Unit 390
Your Personal Tour Guide
Ask me questions while you tour the home.