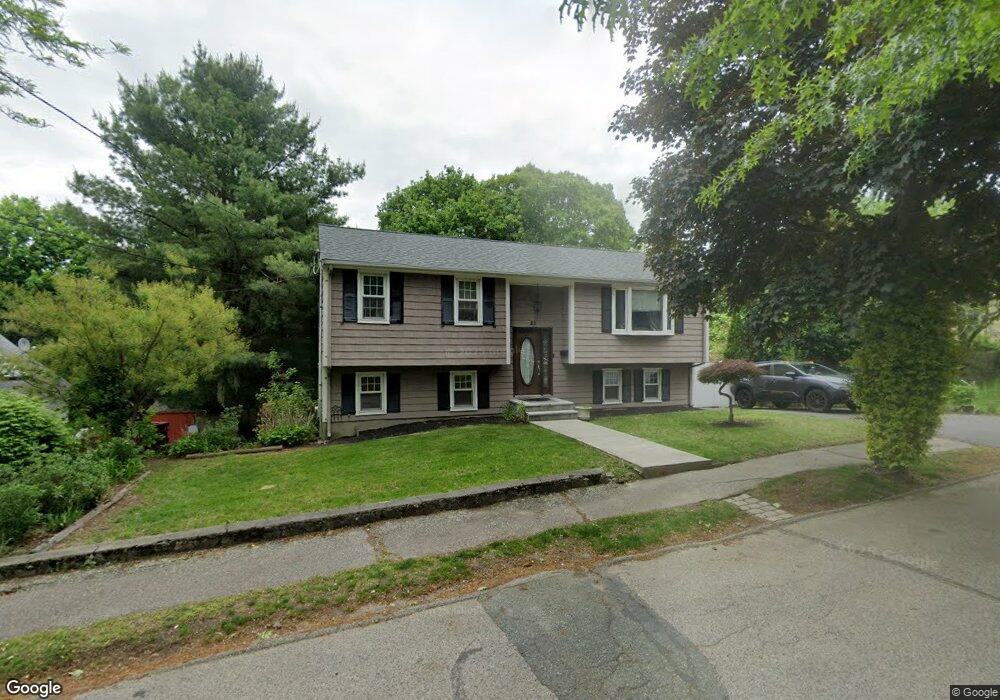
22 Quentin St Milton, MA 02186
Brush Hill NeighborhoodEstimated Value: $759,809 - $1,051,000
2
Beds
3
Baths
2,102
Sq Ft
$405/Sq Ft
Est. Value
About This Home
This home is located at 22 Quentin St, Milton, MA 02186 and is currently estimated at $850,452, approximately $404 per square foot. 22 Quentin St is a home located in Norfolk County with nearby schools including Milton High School, KIPP Academy Boston Charter School, and Delphi Academy.
Ownership History
Date
Name
Owned For
Owner Type
Purchase Details
Closed on
Sep 17, 2020
Sold by
Burke Kevin and Burke Maria T
Bought by
Burke Robin P
Current Estimated Value
Purchase Details
Closed on
Jun 21, 1993
Sold by
Carota Domenico J and Carota Andrea D
Bought by
Burke Kevin and Burke Maria T
Home Financials for this Owner
Home Financials are based on the most recent Mortgage that was taken out on this home.
Original Mortgage
$93,500
Interest Rate
7.38%
Mortgage Type
Purchase Money Mortgage
Create a Home Valuation Report for This Property
The Home Valuation Report is an in-depth analysis detailing your home's value as well as a comparison with similar homes in the area
Home Values in the Area
Average Home Value in this Area
Purchase History
| Date | Buyer | Sale Price | Title Company |
|---|---|---|---|
| Burke Robin P | -- | None Available | |
| Burke Kevin | $153,500 | -- |
Source: Public Records
Mortgage History
| Date | Status | Borrower | Loan Amount |
|---|---|---|---|
| Previous Owner | Burke Kevin | $93,500 |
Source: Public Records
Tax History
| Year | Tax Paid | Tax Assessment Tax Assessment Total Assessment is a certain percentage of the fair market value that is determined by local assessors to be the total taxable value of land and additions on the property. | Land | Improvement |
|---|---|---|---|---|
| 2025 | $6,681 | $602,400 | $344,300 | $258,100 |
| 2024 | $6,636 | $607,700 | $344,300 | $263,400 |
| 2023 | $6,623 | $581,000 | $343,100 | $237,900 |
| 2022 | $6,603 | $529,500 | $343,100 | $186,400 |
| 2021 | $6,331 | $482,200 | $301,600 | $180,600 |
| 2020 | $6,182 | $471,200 | $278,900 | $192,300 |
| 2019 | $6,291 | $477,300 | $270,700 | $206,600 |
| 2018 | $5,844 | $423,200 | $218,100 | $205,100 |
| 2017 | $5,473 | $403,600 | $207,700 | $195,900 |
| 2016 | $5,243 | $388,400 | $194,700 | $193,700 |
| 2015 | $5,287 | $379,300 | $179,200 | $200,100 |
Source: Public Records
Map
Nearby Homes
- 405 Blue Hill Ave
- 58 Adanac Rd
- 73 Hudson St
- 485 Blue Hills Pkwy Unit 10
- 485 Blue Hills Pkwy Unit 12
- 485 Blue Hills Pkwy Unit 33
- 485 Blue Hills Pkwy Unit 13
- 485 Blue Hills Pkwy Unit 2
- 485 Blue Hills Pkwy Unit 20
- 485 Blue Hills Pkwy Unit 49
- 485 Blue Hills Pkwy Unit 6
- 7 Parkway Crescent
- 350 Blue Hill Ave
- 200 Robbins St
- 104 Gulliver St
- 5 Kinsale Ln
- 6 Kinsale Ln
- 75-77 Belnel Rd
- 4 Farmer Rd
- 96 Houston Ave
Your Personal Tour Guide
Ask me questions while you tour the home.