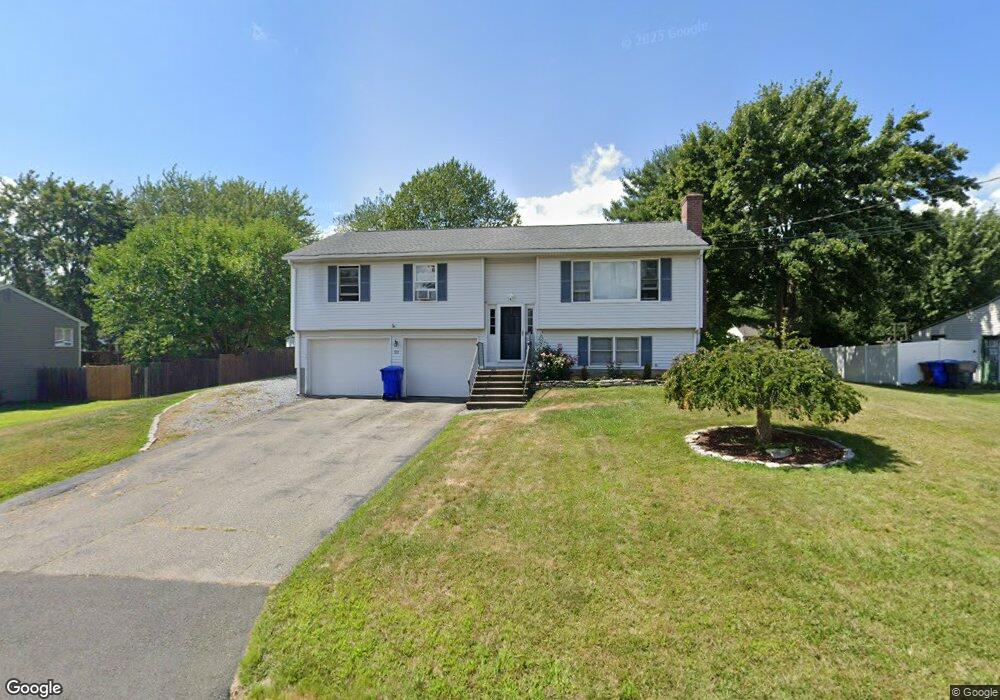
22 Sam St Enfield, CT 06082
Estimated Value: $348,000 - $386,000
3
Beds
2
Baths
1,190
Sq Ft
$310/Sq Ft
Est. Value
About This Home
This home is located at 22 Sam St, Enfield, CT 06082 and is currently estimated at $368,578, approximately $309 per square foot. 22 Sam St is a home located in Hartford County with nearby schools including Edgar H. Parkman School, Nathan Hale Elementary School, and Enfield High School.
Ownership History
Date
Name
Owned For
Owner Type
Purchase Details
Closed on
Aug 31, 2005
Sold by
Berson Adam and Berson Paula
Bought by
Stokowski Shawn
Current Estimated Value
Purchase Details
Closed on
Apr 24, 2003
Sold by
Burns Robert and Burns Andrea
Bought by
Berson Adam and Berson Paula
Purchase Details
Closed on
Jul 1, 1998
Sold by
Quinn Brian and Quinn Joann
Bought by
Burns Robert and Burns Andrea
Create a Home Valuation Report for This Property
The Home Valuation Report is an in-depth analysis detailing your home's value as well as a comparison with similar homes in the area
Home Values in the Area
Average Home Value in this Area
Purchase History
| Date | Buyer | Sale Price | Title Company |
|---|---|---|---|
| Stokowski Shawn | $245,000 | -- | |
| Berson Adam | $184,000 | -- | |
| Burns Robert | $129,000 | -- |
Source: Public Records
Mortgage History
| Date | Status | Borrower | Loan Amount |
|---|---|---|---|
| Open | Burns Robert | $40,000 | |
| Open | Burns Robert | $205,463 |
Source: Public Records
Tax History
| Year | Tax Paid | Tax Assessment Tax Assessment Total Assessment is a certain percentage of the fair market value that is determined by local assessors to be the total taxable value of land and additions on the property. | Land | Improvement |
|---|---|---|---|---|
| 2025 | $6,211 | $177,500 | $56,600 | $120,900 |
| 2024 | $6,044 | $177,500 | $56,600 | $120,900 |
| 2023 | $6,000 | $177,500 | $56,600 | $120,900 |
| 2022 | $5,447 | $177,500 | $56,600 | $120,900 |
| 2021 | $5,197 | $138,480 | $46,890 | $91,590 |
| 2020 | $5,197 | $138,480 | $46,890 | $91,590 |
| 2019 | $5,211 | $138,480 | $46,890 | $91,590 |
| 2018 | $5,124 | $138,480 | $46,890 | $91,590 |
| 2017 | $4,837 | $138,480 | $46,890 | $91,590 |
| 2016 | $4,550 | $132,620 | $46,890 | $85,730 |
| 2015 | $4,408 | $132,620 | $46,890 | $85,730 |
| 2014 | $4,294 | $132,620 | $46,890 | $85,730 |
Source: Public Records
Map
Nearby Homes
Your Personal Tour Guide
Ask me questions while you tour the home.