Estimated Value: $314,384 - $356,000
4
Beds
2
Baths
2,064
Sq Ft
$165/Sq Ft
Est. Value
About This Home
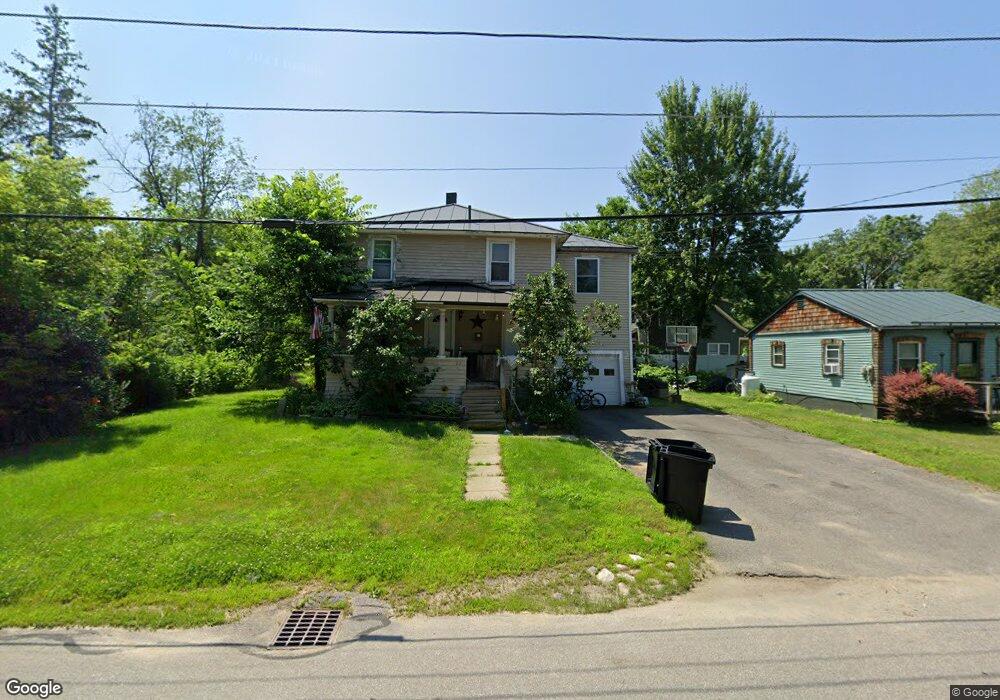
This home is located at 22 Spruce St, Keene, NH 03431 and is currently estimated at $341,096, approximately $165 per square foot. 22 Spruce St is a home with nearby schools including Franklin Elementary School, Keene Middle School, and Mitchell High School.
Ownership History
Date
Name
Owned For
Owner Type
Purchase Details
Closed on
Apr 26, 2001
Sold by
White Michael S and White Kimberli A
Bought by
Dionno Anthony G and Dionno Candi L
Current Estimated Value
Home Financials for this Owner
Home Financials are based on the most recent Mortgage that was taken out on this home.
Original Mortgage
$114,050
Outstanding Balance
$42,113
Interest Rate
6.88%
Estimated Equity
$298,983
Purchase Details
Closed on
Jan 2, 1998
Sold by
Sandberg David W
Bought by
White Michael S
Home Financials for this Owner
Home Financials are based on the most recent Mortgage that was taken out on this home.
Original Mortgage
$83,050
Interest Rate
7.11%
Create a Home Valuation Report for This Property
The Home Valuation Report is an in-depth analysis detailing your home's value as well as a comparison with similar homes in the area
Home Values in the Area
Average Home Value in this Area
Purchase History
| Date | Buyer | Sale Price | Title Company |
|---|---|---|---|
| Dionno Anthony G | $115,000 | -- | |
| White Michael S | $82,500 | -- |
Source: Public Records
Mortgage History
| Date | Status | Borrower | Loan Amount |
|---|---|---|---|
| Open | White Michael S | $114,050 | |
| Previous Owner | White Michael S | $83,050 |
Source: Public Records
Tax History Compared to Growth
Tax History
| Year | Tax Paid | Tax Assessment Tax Assessment Total Assessment is a certain percentage of the fair market value that is determined by local assessors to be the total taxable value of land and additions on the property. | Land | Improvement |
|---|---|---|---|---|
| 2024 | $6,829 | $206,500 | $40,000 | $166,500 |
| 2023 | $6,445 | $202,100 | $40,000 | $162,100 |
| 2022 | $6,271 | $202,100 | $40,000 | $162,100 |
| 2021 | $6,322 | $202,100 | $40,000 | $162,100 |
| 2020 | $6,270 | $168,200 | $46,700 | $121,500 |
| 2019 | $6,324 | $168,200 | $46,700 | $121,500 |
| 2018 | $6,244 | $168,200 | $46,700 | $121,500 |
| 2017 | $6,309 | $169,500 | $48,000 | $121,500 |
| 2016 | $6,168 | $169,500 | $48,000 | $121,500 |
Source: Public Records
Map
Nearby Homes
- 49-51 Howard St
- 50 Forest St
- 67 Woodburn St
- 13 Brook St
- 77 Franklin St
- 37 Church St Unit 3
- 91 Sullivan St
- 0 Stevens St Unit 1
- 2C Valley Creek Ln Unit 2C
- 17 Meetinghouse Rd
- 57 Winchester St
- 22 Fairfield Ct
- 14 Foster St
- 15 Jennison St
- 232 Winchester St
- 194 Marlboro St
- 7 Newman St
- 316 Perk St
- 390 Main St
- 30 Dartmouth St