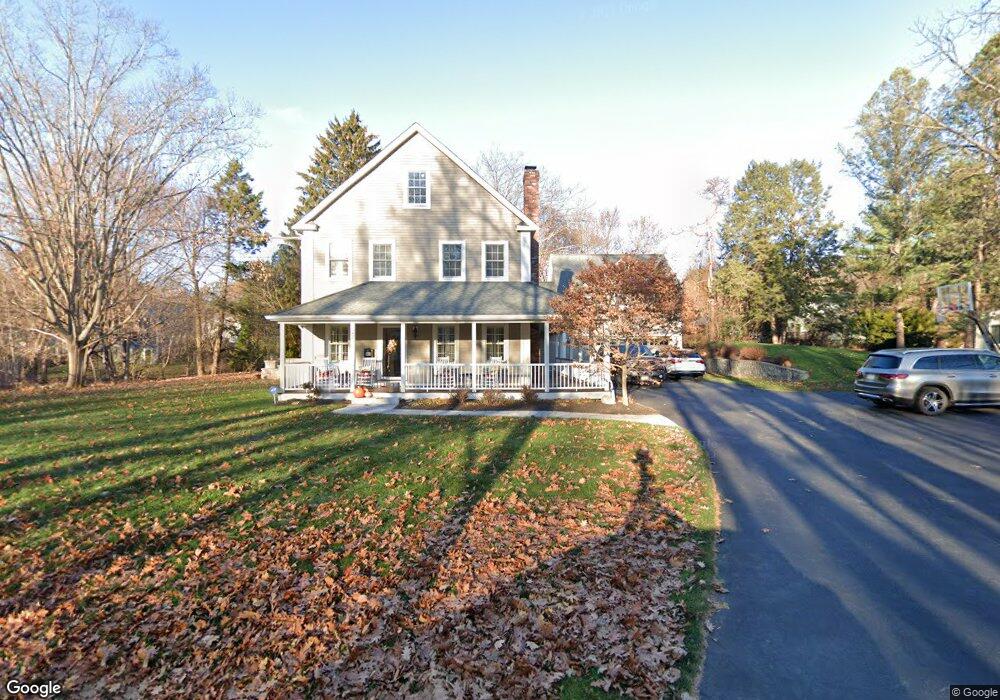
22 Upland Rd Andover, MA 01810
East Andover NeighborhoodEstimated Value: $1,110,000 - $1,589,113
2
Beds
2
Baths
1,729
Sq Ft
$848/Sq Ft
Est. Value
About This Home
This home is located at 22 Upland Rd, Andover, MA 01810 and is currently estimated at $1,465,528, approximately $847 per square foot. 22 Upland Rd is a home located in Essex County with nearby schools including Bancroft Elementary School, Doherty Middle School, and Andover High School.
Ownership History
Date
Name
Owned For
Owner Type
Purchase Details
Closed on
Sep 27, 2017
Sold by
Porter Brian S
Bought by
Porter Brian S and Hanning-Porter Lori
Current Estimated Value
Home Financials for this Owner
Home Financials are based on the most recent Mortgage that was taken out on this home.
Original Mortgage
$275,000
Outstanding Balance
$226,248
Interest Rate
3.89%
Mortgage Type
New Conventional
Estimated Equity
$1,239,280
Purchase Details
Closed on
Jun 28, 2007
Sold by
M R Restoration Llc
Bought by
Porter Brian and Porter Kristin
Purchase Details
Closed on
Nov 29, 2006
Sold by
Arundel Development Ll
Bought by
M R Restoration Llc
Purchase Details
Closed on
Jul 17, 2006
Sold by
Patterson 1 Ft and Patterson
Bought by
Arundel Dev Llc
Create a Home Valuation Report for This Property
The Home Valuation Report is an in-depth analysis detailing your home's value as well as a comparison with similar homes in the area
Home Values in the Area
Average Home Value in this Area
Purchase History
We collect this data history from publicly available records. To have your information removed, we recommend requesting removal directly through your county’s website.
| Date | Buyer | Sale Price | Title Company |
|---|---|---|---|
| Porter Brian S | -- | -- | |
| Porter Brian | -- | -- | |
| Porter Brian | $858,000 | -- | |
| Porter Brian S | $858,000 | -- | |
| Porter Brian S | $858,000 | -- | |
| M R Restoration Llc | $401,000 | -- | |
| M R Restoration Llc | $401,000 | -- | |
| M R Restoration Llc | $401,000 | -- | |
| Arundel Dev Llc | $323,000 | -- | |
| Arundel Dev Llc | $323,000 | -- | |
| Arundel Dev Llc | $323,000 | -- |
Source: Public Records
Mortgage History
We collect this data history from publicly available records. To have your information removed, we recommend requesting removal directly through your county’s website.
| Date | Status | Borrower | Loan Amount |
|---|---|---|---|
| Open | Porter Brian | $275,000 | |
| Closed | Arundel Dev Llc | $275,000 | |
| Previous Owner | Arundel Dev Llc | $350,000 |
Source: Public Records
Tax History
| Year | Tax Paid | Tax Assessment Tax Assessment Total Assessment is a certain percentage of the fair market value that is determined by local assessors to be the total taxable value of land and additions on the property. | Land | Improvement |
|---|---|---|---|---|
| 2025 | $18,127 | $1,451,300 | $605,100 | $846,200 |
| 2024 | $17,391 | $1,350,200 | $554,400 | $795,800 |
| 2023 | $16,694 | $1,222,100 | $499,300 | $722,800 |
| 2022 | $15,898 | $1,088,900 | $441,900 | $647,000 |
| 2021 | $15,287 | $999,800 | $401,700 | $598,100 |
| 2020 | $14,717 | $980,500 | $392,000 | $588,500 |
| 2019 | $14,595 | $955,800 | $376,700 | $579,100 |
| 2018 | $13,941 | $891,400 | $355,300 | $536,100 |
| 2017 | $13,396 | $882,500 | $348,200 | $534,300 |
| 2016 | $13,120 | $885,300 | $348,200 | $537,100 |
| 2015 | $12,653 | $845,200 | $335,000 | $510,200 |
Source: Public Records
Map
Nearby Homes
- 9 Stratford Rd
- 4 Applecrest Rd
- 31 Pine St
- 1 Rogers Brook E
- 33 Chestnut St Unit 2
- 9 Elm Ct
- 10 Elm Ct
- 324 Hillside Rd
- 8 Chestnut St
- 31 School St Unit 1
- 12 Burton Farm Dr
- 156 Elm St
- 49 Salem St
- 625 Turnpike St
- 16R High St
- 2 Powder Mill Square Unit 2B
- 2 Brechin Terrace
- 11 Cuba St
- 20 Washington Park Dr Unit 12
- 70 Washington Park Dr Unit 6
- 124 Chestnut St
- 124 Chestnut St Unit 1
- 122 Chestnut St
- 20 Upland Rd
- 120 Chestnut St
- 135 Chestnut St
- 129 Chestnut St
- 18 Upland Rd
- 139 Chestnut St
- 123 Chestnut St
- 123 Chestnut St
- 123 Chestnut St Unit 123
- 15 Upland Rd
- 16 Upland Rd
- 134 Chestnut St
- 7 Ivanhoe Ln
- 114 Chestnut St
- 18 Stratford Rd
- 12 Ivanhoe Ln
- 119 Chestnut St
Your Personal Tour Guide
Ask me questions while you tour the home.