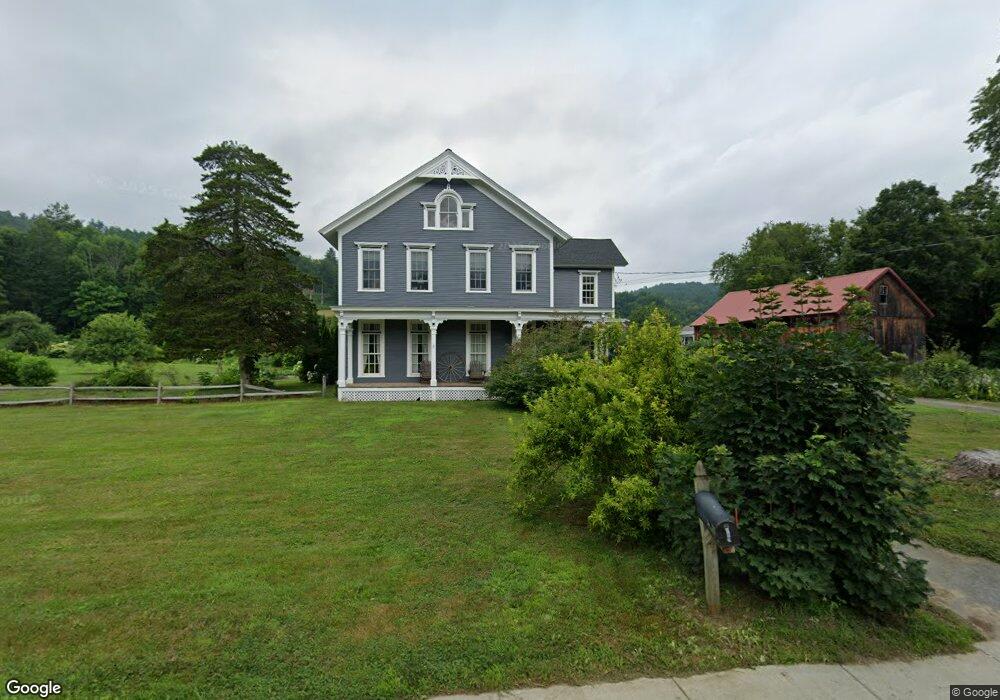
22 Upper St Buckland, MA 01338
Buckland NeighborhoodEstimated Value: $536,846 - $686,000
6
Beds
3
Baths
3,587
Sq Ft
$172/Sq Ft
Est. Value
About This Home
This home is located at 22 Upper St, Buckland, MA 01338 and is currently estimated at $616,212, approximately $171 per square foot. 22 Upper St is a home located in Franklin County with nearby schools including Mohawk Trail Regional High School.
Ownership History
Date
Name
Owned For
Owner Type
Purchase Details
Closed on
Jul 3, 2018
Sold by
Graves Daniel F
Bought by
Lytle Kathleen T
Current Estimated Value
Purchase Details
Closed on
Jun 23, 2008
Sold by
Rich Curtis P
Bought by
Lytle Kathleen T
Purchase Details
Closed on
Sep 20, 2000
Sold by
Henderson John W and Henderson Janice M
Bought by
Rich Curtis P and Lytle Kathleen T
Home Financials for this Owner
Home Financials are based on the most recent Mortgage that was taken out on this home.
Original Mortgage
$199,500
Interest Rate
8%
Mortgage Type
Purchase Money Mortgage
Create a Home Valuation Report for This Property
The Home Valuation Report is an in-depth analysis detailing your home's value as well as a comparison with similar homes in the area
Home Values in the Area
Average Home Value in this Area
Purchase History
| Date | Buyer | Sale Price | Title Company |
|---|---|---|---|
| Lytle Kathleen T | -- | -- | |
| Graves Daniel F | -- | -- | |
| Lytle Kathleen T | -- | -- | |
| Rich Curtis P | $210,000 | -- |
Source: Public Records
Mortgage History
| Date | Status | Borrower | Loan Amount |
|---|---|---|---|
| Previous Owner | Rich Curtis P | $12,800 | |
| Previous Owner | Rich Curtis P | $196,000 | |
| Previous Owner | Rich Curtis P | $199,500 | |
| Previous Owner | Rich Curtis P | $168,000 |
Source: Public Records
Tax History
| Year | Tax Paid | Tax Assessment Tax Assessment Total Assessment is a certain percentage of the fair market value that is determined by local assessors to be the total taxable value of land and additions on the property. | Land | Improvement |
|---|---|---|---|---|
| 2025 | $7,718 | $455,600 | $70,600 | $385,000 |
| 2024 | $7,539 | $429,300 | $70,600 | $358,700 |
| 2023 | $6,620 | $390,800 | $70,600 | $320,200 |
| 2022 | $6,558 | $390,800 | $70,600 | $320,200 |
| 2021 | $5,007 | $336,700 | $70,600 | $266,100 |
| 2020 | $4,632 | $318,300 | $70,600 | $247,700 |
| 2019 | $5,531 | $296,900 | $70,600 | $226,300 |
| 2018 | $5,393 | $286,100 | $70,600 | $215,500 |
| 2017 | $5,164 | $286,100 | $70,600 | $215,500 |
| 2016 | $4,847 | $286,800 | $70,600 | $216,200 |
| 2015 | $4,818 | $286,800 | $70,600 | $216,200 |
Source: Public Records
Map
Nearby Homes
- 0 Upper St
- 7 Hog Hollow Rd
- 1451 Massachusetts 2
- 1451 Route 2 E
- 24 W Oxbow Rd
- 13 Bray Rd
- 2151 Route 2
- 2155 Massachusetts 2
- 10 Deerfield Ave Unit 2
- 30 Main St
- 0 W Oxbow Rd Unit 73453651
- 0 W Oxbow Rd Unit 248444
- 0 N Bear River Rd Unit 73485981
- 0, Lot 7 East Rd
- Lot 3.2 East Rd
- 240 Beldingville Rd
- 220 Hawley Rd
- 40 Suburban Dr
- 527 Main St
- 168 Main St
Your Personal Tour Guide
Ask me questions while you tour the home.