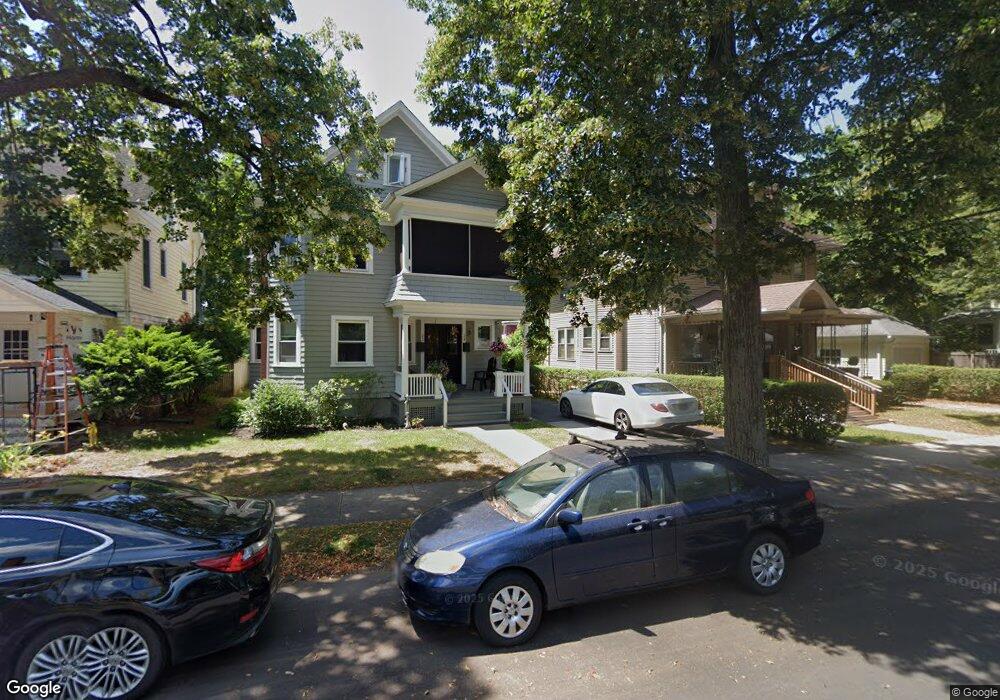
22 W Elm St New Haven, CT 06515
Westville NeighborhoodEstimated Value: $396,000 - $623,000
6
Beds
3
Baths
2,862
Sq Ft
$182/Sq Ft
Est. Value
About This Home
This home is located at 22 W Elm St, New Haven, CT 06515 and is currently estimated at $522,048, approximately $182 per square foot. 22 W Elm St is a home located in New Haven County with nearby schools including Elm City Montessori School and Hopkins School.
Ownership History
Date
Name
Owned For
Owner Type
Purchase Details
Closed on
Aug 20, 2019
Sold by
Samberg Wendy and Champion John
Bought by
Samberg-Champion Johanna
Current Estimated Value
Home Financials for this Owner
Home Financials are based on the most recent Mortgage that was taken out on this home.
Original Mortgage
$160,000
Outstanding Balance
$140,130
Interest Rate
3.7%
Mortgage Type
Purchase Money Mortgage
Estimated Equity
$381,918
Purchase Details
Closed on
Oct 23, 2018
Sold by
Bozzi James A and Bozzi Albert Stephen
Bought by
Samberg Wendy and Champion John
Purchase Details
Closed on
Sep 28, 2018
Sold by
Boutaugh Benjamin R
Bought by
Samberg Wendy and Champion John
Purchase Details
Closed on
Aug 3, 2018
Sold by
Debowes Brian C and Debowes Ellen M
Bought by
Samberg Wendy and Champion John
Purchase Details
Closed on
Jul 26, 2017
Sold by
Finn Emily B and Finn Matthew
Bought by
Samberg Wendy and Champion John
Create a Home Valuation Report for This Property
The Home Valuation Report is an in-depth analysis detailing your home's value as well as a comparison with similar homes in the area
Home Values in the Area
Average Home Value in this Area
Purchase History
| Date | Buyer | Sale Price | Title Company |
|---|---|---|---|
| Samberg-Champion Johanna | $200,000 | -- | |
| Samberg Wendy | -- | -- | |
| Samberg Wendy | -- | -- | |
| Samberg Wendy | -- | -- | |
| Samberg Wendy | -- | -- |
Source: Public Records
Mortgage History
| Date | Status | Borrower | Loan Amount |
|---|---|---|---|
| Open | Samberg-Champion Johanna | $160,000 | |
| Previous Owner | Samberg Wendy | $150,000 | |
| Previous Owner | Samberg Wendy | $50,000 |
Source: Public Records
Tax History Compared to Growth
Tax History
| Year | Tax Paid | Tax Assessment Tax Assessment Total Assessment is a certain percentage of the fair market value that is determined by local assessors to be the total taxable value of land and additions on the property. | Land | Improvement |
|---|---|---|---|---|
| 2025 | $9,518 | $241,570 | $74,340 | $167,230 |
| 2024 | $9,300 | $241,570 | $74,340 | $167,230 |
| 2023 | $8,986 | $241,570 | $74,340 | $167,230 |
| 2022 | $9,602 | $241,570 | $74,340 | $167,230 |
| 2021 | $7,129 | $162,470 | $57,960 | $104,510 |
| 2020 | $7,129 | $162,470 | $57,960 | $104,510 |
| 2019 | $6,983 | $162,470 | $57,960 | $104,510 |
| 2018 | $6,983 | $162,470 | $57,960 | $104,510 |
| 2017 | $6,284 | $162,470 | $57,960 | $104,510 |
| 2016 | $6,532 | $157,220 | $68,600 | $88,620 |
| 2015 | $6,532 | $157,220 | $68,600 | $88,620 |
| 2014 | $6,532 | $157,220 | $68,600 | $88,620 |
Source: Public Records
Map
Nearby Homes
- 206 W Rock Ave
- 55 Marvel Rd
- 96 Hubinger St
- 595 Central Ave
- 119 Westwood Rd
- 1975 Chapel St
- 126 Willard St
- 907 Elm St
- 865 Elm St
- 868 Elm St
- 257 Blake St
- 1016 Whalley Ave Unit 6
- 999 Whalley Ave Unit 1H
- 471 Whalley Ave Unit G
- 151 Fitch St
- 168 Ellsworth Ave
- 57 Austin St
- 120 Emerson St
- 141 Valley St
- 360 Fountain St Unit 5