22 Water St Chagrin Falls, OH 44022
Estimated Value: $533,000 - $668,000
3
Beds
2
Baths
1,478
Sq Ft
$405/Sq Ft
Est. Value
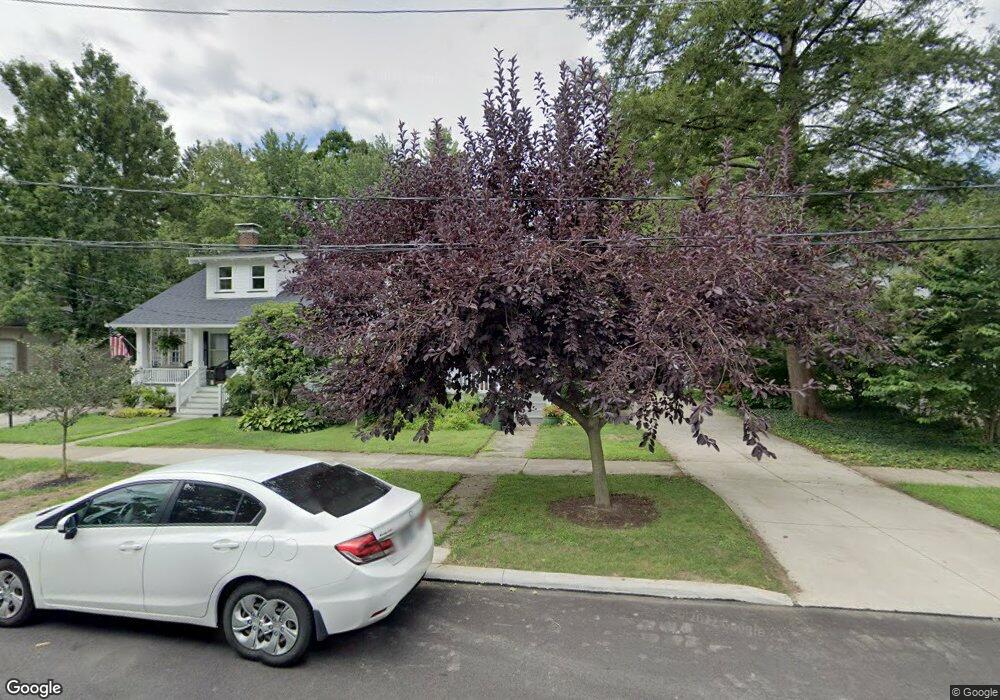
About This Home
This home is located at 22 Water St, Chagrin Falls, OH 44022 and is currently estimated at $599,048, approximately $405 per square foot. 22 Water St is a home located in Cuyahoga County with nearby schools including Gurney Elementary School, Chagrin Falls Intermediate Elementary School, and Chagrin Falls Middle School.
Ownership History
Date
Name
Owned For
Owner Type
Purchase Details
Closed on
Jun 9, 2009
Sold by
Tomaro Michael B
Bought by
Lipp Stuart and Lipp Julia Martens
Current Estimated Value
Home Financials for this Owner
Home Financials are based on the most recent Mortgage that was taken out on this home.
Original Mortgage
$224,000
Outstanding Balance
$141,984
Interest Rate
4.83%
Mortgage Type
Purchase Money Mortgage
Estimated Equity
$457,064
Purchase Details
Closed on
Jan 10, 2007
Sold by
Tomaro Michael B and Sabo Leslie A
Bought by
Tomaro Michael B
Purchase Details
Closed on
Jun 12, 1981
Sold by
Jones David R
Bought by
Tomaro Mary K
Purchase Details
Closed on
Jul 26, 1978
Sold by
Mcfarland Richard J and Mcfarland Naomi
Bought by
Jones David R
Purchase Details
Closed on
Jan 1, 1975
Bought by
Mcfarland Richard J and Mcfarland Naomi
Create a Home Valuation Report for This Property
The Home Valuation Report is an in-depth analysis detailing your home's value as well as a comparison with similar homes in the area
Home Values in the Area
Average Home Value in this Area
Purchase History
| Date | Buyer | Sale Price | Title Company |
|---|---|---|---|
| Lipp Stuart | $280,500 | Barristers Title Agency | |
| Tomaro Michael B | -- | Attorney | |
| Tomaro Mary K | $87,500 | -- | |
| Jones David R | $72,500 | -- | |
| Mcfarland Richard J | -- | -- |
Source: Public Records
Mortgage History
| Date | Status | Borrower | Loan Amount |
|---|---|---|---|
| Open | Lipp Stuart | $224,000 |
Source: Public Records
Tax History Compared to Growth
Tax History
| Year | Tax Paid | Tax Assessment Tax Assessment Total Assessment is a certain percentage of the fair market value that is determined by local assessors to be the total taxable value of land and additions on the property. | Land | Improvement |
|---|---|---|---|---|
| 2024 | $8,907 | $154,245 | $35,280 | $118,965 |
| 2023 | $9,469 | $142,210 | $47,080 | $95,130 |
| 2022 | $10,048 | $142,210 | $47,080 | $95,130 |
| 2021 | $10,004 | $142,210 | $47,080 | $95,130 |
| 2020 | $8,528 | $113,750 | $37,660 | $76,090 |
| 2019 | $8,399 | $325,000 | $107,600 | $217,400 |
| 2018 | $8,352 | $113,750 | $37,660 | $76,090 |
| 2017 | $7,503 | $98,000 | $28,420 | $69,580 |
| 2016 | $6,736 | $98,000 | $28,420 | $69,580 |
| 2015 | $6,644 | $98,000 | $28,420 | $69,580 |
| 2014 | $6,644 | $95,240 | $25,830 | $69,410 |
Source: Public Records
Map
Nearby Homes
- 106 W Washington St
- 58 W Orange St
- 81 Hall St
- 156 S Franklin St
- 20 Solether Ln
- 235 Solon Rd Unit D
- 110 Emilia Ct
- 80 South St
- 115 E Summit St
- 207 S Main St
- 213 S Main St
- 219 S Main St
- 225 S Main St
- 310 Falls Walk Way
- 0 Bell St
- 150 Greentree Rd
- 389 Bentleyville Rd
- 5 Skyline Dr
- 9 E Carriage Dr
- 16690 Dayton St