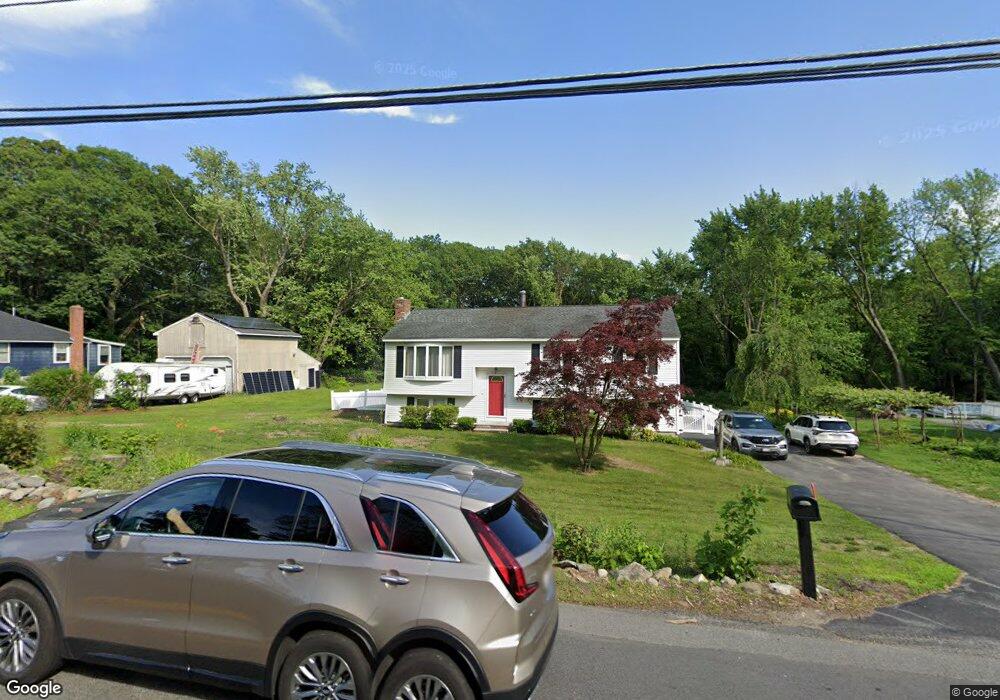
22 West St Methuen, MA 01844
The West End NeighborhoodEstimated Value: $598,000 - $659,000
3
Beds
2
Baths
1,144
Sq Ft
$560/Sq Ft
Est. Value
About This Home
This home is located at 22 West St, Methuen, MA 01844 and is currently estimated at $640,656, approximately $560 per square foot. 22 West St is a home located in Essex County with nearby schools including Marsh Grammar School, Methuen High School, and Fellowship Christian Academy.
Ownership History
Date
Name
Owned For
Owner Type
Purchase Details
Closed on
Aug 14, 2002
Sold by
Dasilva Alberto R and Dasilva Maria A
Bought by
Moore John R
Current Estimated Value
Home Financials for this Owner
Home Financials are based on the most recent Mortgage that was taken out on this home.
Original Mortgage
$80,000
Outstanding Balance
$33,997
Interest Rate
6.61%
Mortgage Type
Purchase Money Mortgage
Estimated Equity
$606,659
Create a Home Valuation Report for This Property
The Home Valuation Report is an in-depth analysis detailing your home's value as well as a comparison with similar homes in the area
Home Values in the Area
Average Home Value in this Area
Purchase History
| Date | Buyer | Sale Price | Title Company |
|---|---|---|---|
| Moore John R | $290,000 | -- | |
| Moore John R | $290,000 | -- |
Source: Public Records
Mortgage History
| Date | Status | Borrower | Loan Amount |
|---|---|---|---|
| Open | Moore John R | $80,000 | |
| Closed | Moore John R | $80,000 | |
| Previous Owner | Moore John R | $52,000 |
Source: Public Records
Tax History
| Year | Tax Paid | Tax Assessment Tax Assessment Total Assessment is a certain percentage of the fair market value that is determined by local assessors to be the total taxable value of land and additions on the property. | Land | Improvement |
|---|---|---|---|---|
| 2025 | $6,151 | $581,400 | $296,600 | $284,800 |
| 2024 | $6,138 | $565,200 | $270,600 | $294,600 |
| 2023 | $5,808 | $496,400 | $240,500 | $255,900 |
| 2022 | $5,570 | $426,800 | $200,400 | $226,400 |
| 2021 | $5,304 | $402,100 | $190,400 | $211,700 |
| 2020 | $5,285 | $393,200 | $190,400 | $202,800 |
| 2019 | $4,932 | $347,600 | $170,400 | $177,200 |
| 2018 | $4,682 | $328,100 | $170,400 | $157,700 |
| 2017 | $4,549 | $310,500 | $170,400 | $140,100 |
| 2016 | $4,362 | $294,500 | $160,300 | $134,200 |
| 2015 | $4,257 | $291,600 | $160,300 | $131,300 |
Source: Public Records
Map
Nearby Homes
- 296 Pelham St
- 252 Pelham St
- 37 Lexington Ave
- 65 Pinehurst Ave
- 42 Perley St
- 2 Westwind Dr
- 290 Salem Rd
- 37 Summer Hill Rd
- 146 Hampshire Rd
- 245 Salem Rd
- 25 Newbury Rd
- 6 Newbury Rd
- 6 Newbury Rd Unit M18 B12-16 L7
- 3 Oxyoke Dr
- 280 & 290 Spring Rd
- 2 Landmark Dr
- 298 Salem Rd
- 302 Salem Rd
- 35 Cross St
- 5 Bailey Rd
Your Personal Tour Guide
Ask me questions while you tour the home.