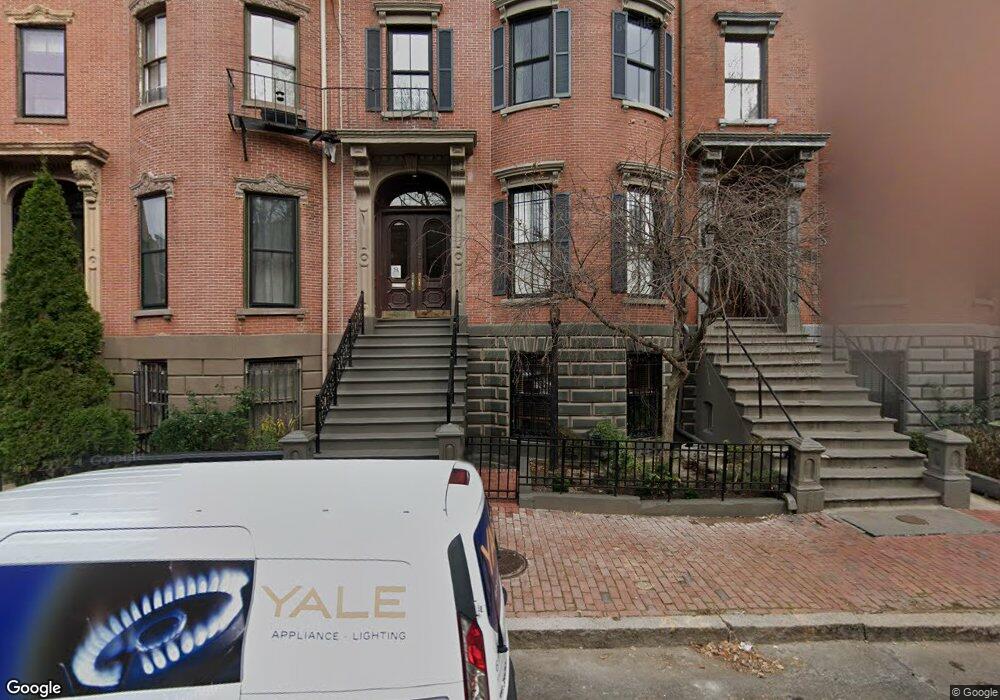
22 Worcester Square Unit 3 Boston, MA 02118
South End NeighborhoodEstimated Value: $1,703,000 - $1,967,231
2
Beds
2
Baths
9,999
Sq Ft
$180/Sq Ft
Est. Value
About This Home
This home is located at 22 Worcester Square Unit 3, Boston, MA 02118 and is currently estimated at $1,797,808, approximately $179 per square foot. 22 Worcester Square Unit 3 is a home located in Suffolk County with nearby schools including Dudley Street Neighborhood Charter School and Cathedral High School.
Ownership History
Date
Name
Owned For
Owner Type
Purchase Details
Closed on
Oct 1, 2002
Sold by
Everly Anne W
Bought by
Kramer Maria A
Current Estimated Value
Home Financials for this Owner
Home Financials are based on the most recent Mortgage that was taken out on this home.
Original Mortgage
$588,000
Outstanding Balance
$248,135
Interest Rate
6.25%
Mortgage Type
Purchase Money Mortgage
Estimated Equity
$1,549,673
Purchase Details
Closed on
Oct 16, 2000
Sold by
Mitchell Jeffrey S
Bought by
Everly Anne W and Shepard Aaron
Purchase Details
Closed on
Mar 10, 1999
Sold by
Vonhauenschild Gerhard
Bought by
Mitchell Jeffrey S
Purchase Details
Closed on
Oct 16, 1991
Sold by
Garden Mgmt Co Inc
Bought by
Vonhauenschild G
Purchase Details
Closed on
Apr 17, 1991
Sold by
Carr Paul P
Bought by
Garden Mgmt Co Inc
Create a Home Valuation Report for This Property
The Home Valuation Report is an in-depth analysis detailing your home's value as well as a comparison with similar homes in the area
Home Values in the Area
Average Home Value in this Area
Purchase History
| Date | Buyer | Sale Price | Title Company |
|---|---|---|---|
| Kramer Maria A | $715,000 | -- | |
| Everly Anne W | $699,000 | -- | |
| Mitchell Jeffrey S | $450,000 | -- | |
| Vonhauenschild G | $115,000 | -- | |
| Garden Mgmt Co Inc | $127,666 | -- | |
| Garden Mgmt Co Inc | $127,666 | -- |
Source: Public Records
Mortgage History
| Date | Status | Borrower | Loan Amount |
|---|---|---|---|
| Open | Garden Mgmt Co Inc | $150,000 | |
| Open | Garden Mgmt Co Inc | $588,000 |
Source: Public Records
Tax History Compared to Growth
Tax History
| Year | Tax Paid | Tax Assessment Tax Assessment Total Assessment is a certain percentage of the fair market value that is determined by local assessors to be the total taxable value of land and additions on the property. | Land | Improvement |
|---|---|---|---|---|
| 2025 | $20,299 | $1,752,900 | $0 | $1,752,900 |
| 2024 | $18,639 | $1,710,000 | $0 | $1,710,000 |
| 2023 | $17,999 | $1,675,900 | $0 | $1,675,900 |
| 2022 | $18,056 | $1,659,600 | $0 | $1,659,600 |
| 2021 | $17,361 | $1,627,100 | $0 | $1,627,100 |
| 2020 | $16,427 | $1,555,600 | $0 | $1,555,600 |
| 2019 | $15,915 | $1,510,000 | $0 | $1,510,000 |
| 2018 | $14,922 | $1,423,900 | $0 | $1,423,900 |
| 2017 | $14,361 | $1,356,100 | $0 | $1,356,100 |
| 2016 | $14,344 | $1,304,000 | $0 | $1,304,000 |
| 2015 | $13,374 | $1,104,400 | $0 | $1,104,400 |
| 2014 | $12,609 | $1,002,300 | $0 | $1,002,300 |
Source: Public Records
Map
Nearby Homes
- 28 Worcester Square Unit 4
- 771 Harrison Ave Unit 6G
- 771 Harrison Ave Unit 304
- 771 Harrison Ave Unit 207
- 771 Harrison Ave Unit PH612
- 771 Harrison Ave Unit 9G
- 1666 Washington St Unit 2
- 19 Worcester Square Unit 1
- 21 Worcester Square Unit 2
- 1 Worcester Square Unit 4
- 41 Worcester Square Unit 7
- 41 Worcester Square Unit 4
- 50 E Springfield St Unit 1
- 58 E Springfield St Unit 1
- 2 Cumston St
- 7 E Springfield St Unit 5B
- 7 E Springfield St Unit PH6
- 476 Shawmut Ave Unit 3
- 43 W Newton St Unit 1-10
- 681 Massachusetts Ave Unit 1
- 24 Worcester Square Unit 6
- 24 Worcester Square Unit 5
- 24 Worcester Square Unit 4
- 24 Worcester Square Unit 3
- 24 Worcester Square Unit 2
- 24 Worcester Square Unit 1
- 24 Worcester Square Unit FURNISHED
- 24 Worcester Square Unit B
- 22 Worcester Square Unit 2
- 22 Worcester Square Unit 1
- 22 Worcester Square Unit 5
- 20 Worcester Square Unit 4
- 20 Worcester Square Unit 1
- 20 Worcester Square Unit 5
- 20 Worcester Square Unit 2
- 20 Worcester Square
- 20 Worcester Square Unit 3
- 26 Worcester Square Unit 5
- 26 Worcester Square Unit 4
- 26 Worcester Square Unit 3