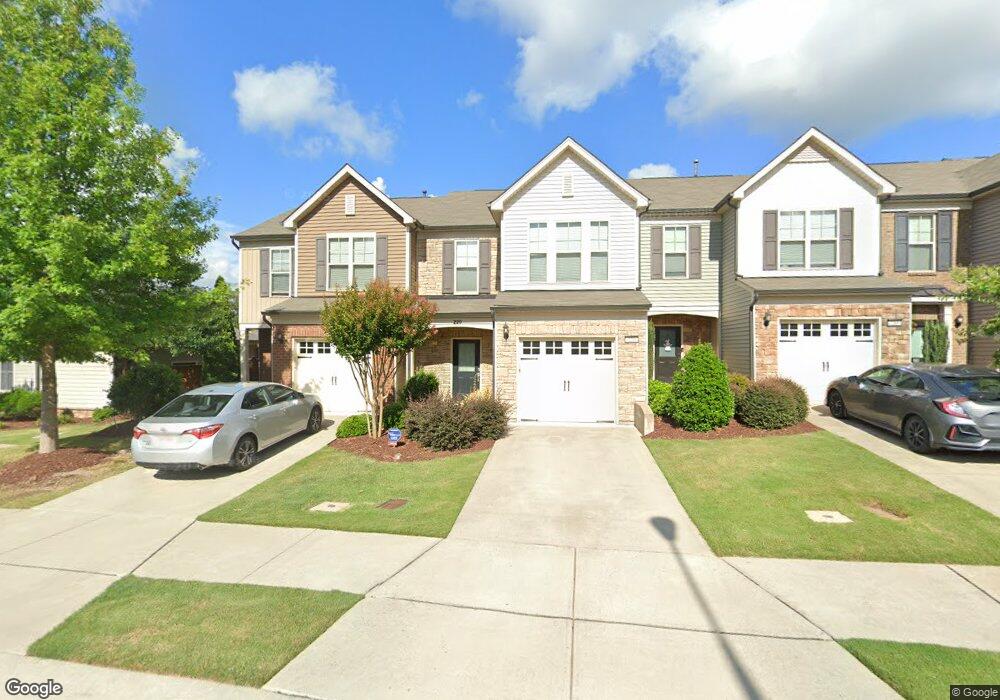
220 Brier Crossings Loop Unit BCV 35 Durham, NC 27703
Eastern Durham NeighborhoodEstimated Value: $365,000 - $391,000
3
Beds
3
Baths
1,564
Sq Ft
$239/Sq Ft
Est. Value
About This Home
This home is located at 220 Brier Crossings Loop Unit BCV 35, Durham, NC 27703 and is currently estimated at $374,480, approximately $239 per square foot. 220 Brier Crossings Loop Unit BCV 35 is a home located in Durham County with nearby schools including Spring Valley Elementary School, John W Neal Middle School, and Southern School of Energy & Sustainability.
Ownership History
Date
Name
Owned For
Owner Type
Purchase Details
Closed on
Dec 21, 2022
Sold by
Holler Peter B and Holler Deirdre
Bought by
Holler Peter B and Viera-Holler Deirdre
Current Estimated Value
Purchase Details
Closed on
Dec 16, 2015
Sold by
Pulte Home Corporation
Bought by
Holler Peter B and Viera Holler Deirdre
Create a Home Valuation Report for This Property
The Home Valuation Report is an in-depth analysis detailing your home's value as well as a comparison with similar homes in the area
Home Values in the Area
Average Home Value in this Area
Purchase History
| Date | Buyer | Sale Price | Title Company |
|---|---|---|---|
| Holler Peter B | -- | -- | |
| Holler Peter B | $240,000 | Attorney |
Source: Public Records
Tax History Compared to Growth
Tax History
| Year | Tax Paid | Tax Assessment Tax Assessment Total Assessment is a certain percentage of the fair market value that is determined by local assessors to be the total taxable value of land and additions on the property. | Land | Improvement |
|---|---|---|---|---|
| 2025 | $3,928 | $396,283 | $90,000 | $306,283 |
| 2024 | $3,503 | $251,156 | $48,000 | $203,156 |
| 2023 | $3,290 | $251,156 | $48,000 | $203,156 |
| 2022 | $3,215 | $251,156 | $48,000 | $203,156 |
| 2021 | $3,199 | $251,156 | $48,000 | $203,156 |
| 2020 | $3,124 | $251,156 | $48,000 | $203,156 |
| 2019 | $3,124 | $251,156 | $48,000 | $203,156 |
| 2018 | $2,616 | $192,866 | $38,000 | $154,866 |
| 2017 | $2,597 | $192,866 | $38,000 | $154,866 |
| 2016 | $2,509 | $192,866 | $38,000 | $154,866 |
| 2015 | $2,549 | $184,132 | $43,000 | $141,132 |
Source: Public Records
Map
Nearby Homes
- 320 Brier Crossings Loop
- 415 Brier Crossings Loop
- 512 Brier Crossings Loop
- 501 Brier Crossings Loop
- 519 Brier Crossings Loop
- 1108 Areca Way
- 212 Marietta Way
- 825 Gaston Manor Dr
- 229 Marietta Way
- 2125 Curry Meadow Way
- 211 Andrews Chapel Rd
- 2137 Curry Meadow Way
- 7125 Crested Iris Place
- 9208 Palm Bay Cir
- 7864 Silverthread Ln
- 7704 Winners Edge St
- 2212 Bloomsbury Manor Dr
- 7824 Silverthread Ln
- 4516 Carpenter Pond Rd
- 7621 Satinwing Ln
- 222 Brier Crossings Loop Unit BCV 34
- 222 Brier Crossings Loop
- 218 Brier Crossings Loop
- 216 Brier Crossings Loop
- 214 Brier Crossings Loop
- 212 Brier Crossings Loop
- 210 Brier Crossings Loop
- 223 Brier Crossings Loop
- 221 Brier Crossings Loop
- 225 Brier Crossings Loop
- 217 Brier Crossings Loop
- 215 Brier Crossings Loop
- 227 Brier Crossings Loop
- 208 Brier Crossings Loop
- 107 Comptonfield Dr
- 213 Brier Crossings Loop
- 109 Comptonfield Dr
- 229 Brier Crossings Loop
- 231 Brier Crossings Loop
- 111 Comptonfield Dr