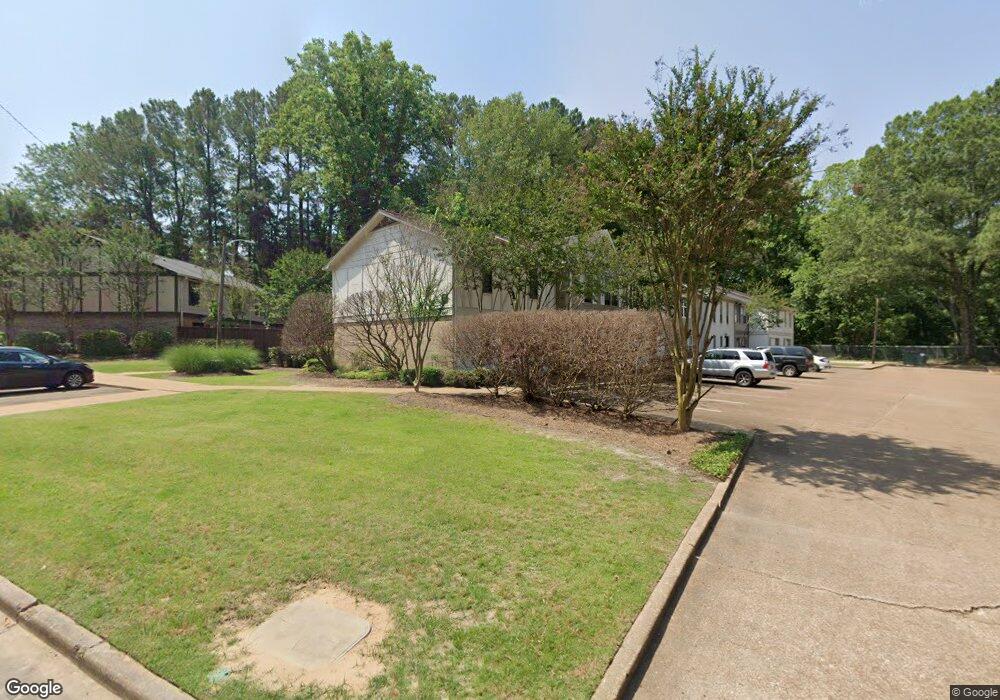
220 Elm St Unit 11 Oxford, MS 38655
Estimated Value: $290,000 - $424,000
--
Bed
1
Bath
1,248
Sq Ft
$283/Sq Ft
Est. Value
About This Home
This home is located at 220 Elm St Unit 11, Oxford, MS 38655 and is currently estimated at $353,099, approximately $282 per square foot. 220 Elm St Unit 11 is a home located in Lafayette County with nearby schools including Central Elementary School, Bramlett Elementary School, and Della Davidson Elementary School.
Ownership History
Date
Name
Owned For
Owner Type
Purchase Details
Closed on
Mar 26, 2021
Sold by
Wilson Michael A
Bought by
Kreunen Gail Y
Current Estimated Value
Purchase Details
Closed on
Jul 23, 2020
Sold by
Chambliss Ann M
Bought by
Wilson Michael A
Home Financials for this Owner
Home Financials are based on the most recent Mortgage that was taken out on this home.
Original Mortgage
$171,000
Interest Rate
3.2%
Mortgage Type
New Conventional
Purchase Details
Closed on
Aug 7, 2015
Sold by
Wilson Michael A and Gottsche Germaine
Bought by
Chambliss Ann M
Purchase Details
Closed on
Apr 11, 2011
Sold by
Mcneely James G
Bought by
Wilson Michael A and Wilson Germaine Gottsche
Home Financials for this Owner
Home Financials are based on the most recent Mortgage that was taken out on this home.
Original Mortgage
$110,050
Interest Rate
4.85%
Mortgage Type
Unknown
Create a Home Valuation Report for This Property
The Home Valuation Report is an in-depth analysis detailing your home's value as well as a comparison with similar homes in the area
Home Values in the Area
Average Home Value in this Area
Purchase History
| Date | Buyer | Sale Price | Title Company |
|---|---|---|---|
| Kreunen Gail Y | -- | None Available | |
| Wilson Michael A | -- | None Available | |
| Chambliss Ann M | -- | None Available | |
| Wilson Michael A | -- | None Available |
Source: Public Records
Mortgage History
| Date | Status | Borrower | Loan Amount |
|---|---|---|---|
| Previous Owner | Wilson Michael A | $171,000 | |
| Previous Owner | Wilson Michael A | $110,050 | |
| Previous Owner | Wilson Michael A | $110,050 |
Source: Public Records
Tax History Compared to Growth
Tax History
| Year | Tax Paid | Tax Assessment Tax Assessment Total Assessment is a certain percentage of the fair market value that is determined by local assessors to be the total taxable value of land and additions on the property. | Land | Improvement |
|---|---|---|---|---|
| 2024 | $2,711 | $20,523 | $0 | $0 |
| 2023 | $2,711 | $20,523 | $0 | $0 |
| 2022 | $2,670 | $20,523 | $0 | $0 |
| 2021 | $738 | $20,523 | $0 | $0 |
| 2020 | $695 | $19,886 | $0 | $0 |
| 2019 | $695 | $19,886 | $0 | $0 |
| 2018 | $695 | $19,886 | $0 | $0 |
| 2017 | $695 | $19,886 | $0 | $0 |
| 2016 | $650 | $19,271 | $0 | $0 |
| 2015 | -- | $19,271 | $0 | $0 |
| 2014 | -- | $19,271 | $0 | $0 |
Source: Public Records
Map
Nearby Homes
- 309/311 Washington Ave
- 307/309 Washington Ave
- 1013 Jefferson Ave
- 1000 Jefferson Ave
- 201 Eagle Springs Rd
- 603 Molly Barr Rd
- 514 Jackson Ave E
- 401 Jackson Ave E
- #11 200 Washington Ave
- 4915 S Lamar Blvd
- 419 Van Buren Ave
- 450 Lily Loop
- 446 Lily Loop
- 448 Lily Loop
- 1113 Belle Terre Ln
- 33 Cr 223
- 33 Cr224
- 602 Greenhaven
- 220 Elm St Unit 14
- 220 Elm St Unit 19
- 220 Elm St Unit 20
- 220 Elm St Unit 12
- 220 Elm St Unit 10
- 220 Elm St Unit 9
- 220 Elm St Unit 8
- 220 Elm St Unit 7
- 220 Elm St Unit 6
- 220 Elm St Unit 5
- 220 Elm St Unit 4
- 220 Elm St Unit 3
- 220 Elm St Unit 2
- 220 Elm St Unit 1
- 220 Elm St Unit 25
- 220 Elm St Unit 23
- 220 Elm St Unit 21
- 220 Elm St Unit 18
- 220 Elm St Unit 17
- 220 Elm St