Estimated Value: $677,000 - $765,000
3
Beds
2
Baths
2,575
Sq Ft
$279/Sq Ft
Est. Value
About This Home
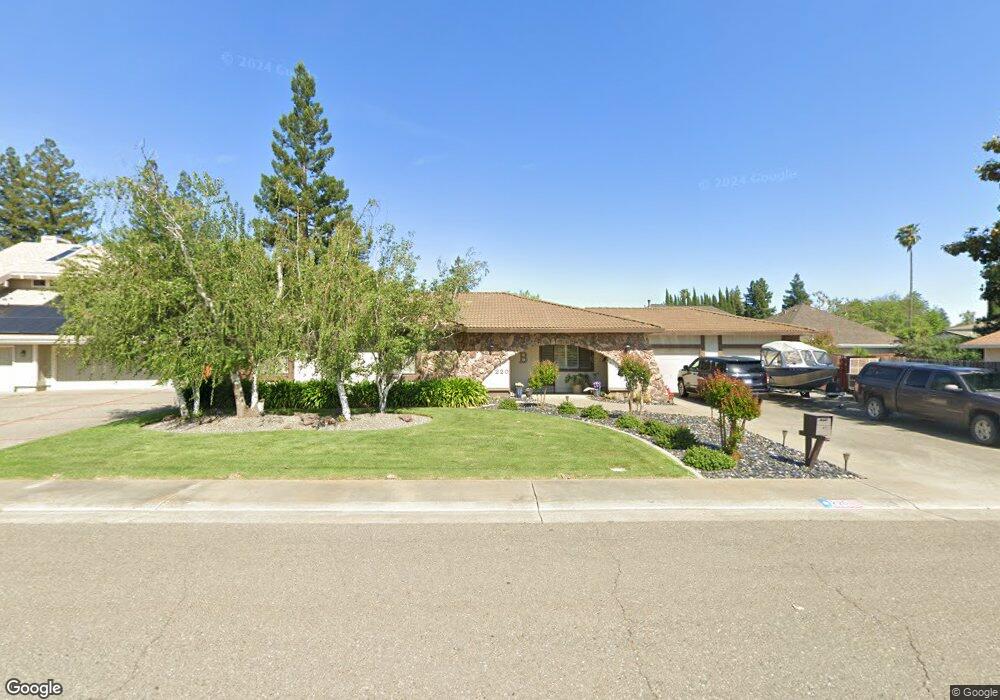
This home is located at 220 Everglade Way, Dixon, CA 95620 and is currently estimated at $717,481, approximately $278 per square foot. 220 Everglade Way is a home located in Solano County with nearby schools including Anderson (Linford L.) Elementary School, Dixon High School, and Dixon Montessori Charter.
Ownership History
Date
Name
Owned For
Owner Type
Purchase Details
Closed on
Aug 29, 2019
Sold by
Brownell Kenneith K and Brownlee Vichi
Bought by
Brownlee Kenneth E and Brownlee Vichi L
Current Estimated Value
Purchase Details
Closed on
May 1, 2018
Sold by
Utterback Rebecca Sue and Perry R Loony Revocable Trust
Bought by
Brownlee Kenneth E and Brownlee Vichi
Home Financials for this Owner
Home Financials are based on the most recent Mortgage that was taken out on this home.
Original Mortgage
$272,500
Outstanding Balance
$234,901
Interest Rate
4.45%
Mortgage Type
New Conventional
Estimated Equity
$482,580
Purchase Details
Closed on
Mar 14, 2000
Sold by
Looney Perry R
Bought by
Looney Perry R
Purchase Details
Closed on
Feb 15, 2000
Sold by
Looney Clyde Ray
Bought by
Looney Perry R
Create a Home Valuation Report for This Property
The Home Valuation Report is an in-depth analysis detailing your home's value as well as a comparison with similar homes in the area
Home Values in the Area
Average Home Value in this Area
Purchase History
| Date | Buyer | Sale Price | Title Company |
|---|---|---|---|
| Brownlee Kenneth E | -- | None Available | |
| Brownlee Kenneth E | $545,000 | Placer Title Co | |
| Looney Perry R | -- | -- | |
| Looney Perry R | -- | -- |
Source: Public Records
Mortgage History
| Date | Status | Borrower | Loan Amount |
|---|---|---|---|
| Open | Brownlee Kenneth E | $272,500 |
Source: Public Records
Tax History
| Year | Tax Paid | Tax Assessment Tax Assessment Total Assessment is a certain percentage of the fair market value that is determined by local assessors to be the total taxable value of land and additions on the property. | Land | Improvement |
|---|---|---|---|---|
| 2025 | $6,790 | $620,111 | $142,226 | $477,885 |
| 2024 | $6,790 | $623,334 | $139,438 | $483,896 |
| 2023 | $6,587 | $596,033 | $136,704 | $459,329 |
| 2022 | $6,490 | $584,347 | $134,024 | $450,323 |
| 2021 | $6,410 | $572,891 | $131,397 | $441,494 |
| 2020 | $6,305 | $567,018 | $130,050 | $436,968 |
| 2019 | $6,186 | $555,900 | $127,500 | $428,400 |
| 2018 | $2,700 | $242,186 | $63,736 | $178,450 |
| 2017 | $2,631 | $237,438 | $62,487 | $174,951 |
| 2016 | $2,511 | $232,783 | $61,262 | $171,521 |
| 2015 | $2,452 | $229,287 | $60,342 | $168,945 |
| 2014 | $2,425 | $224,796 | $59,160 | $165,636 |
Source: Public Records
Map
Nearby Homes
- 1150 Mulberry Ln
- 1155 Mulberry Ln
- 1250 Redwood Ct
- 1310 Hawthorne Ct
- 625 Cypress St
- 970 Camelia Dr
- 1330 Blackberry Ct
- 625 Peony Ct
- 689 W C St
- 650 W C St
- 1315 Jacobs Place
- 1365 Jacobs Place
- 550 N Lincoln St
- 905 W F St
- 1450 Stonecrop Ln
- 1500 Goldfield Ct
- 745 Jasmine St
- 1535 Arlington Ct
- 775 Cahill Ct
- 630 Sierra Dr
- 940 Silver Ridge Place
- 210 Everglade Way
- 215 Fernwood Way
- 225 Fernwood Way
- 215 Everglade Way
- 1000 Silver Ridge Place
- 200 Everglade Unkn
- 200 Everglade Way
- 205 Fernwood Way
- 205 Everglade Way
- 935 Silver Ridge Place
- 945 Silver Ridge Place
- 235 Fernwood Way
- 215 S Lincoln St
- 1020 Silver Ridge Place
- 1015 Silver Ridge Place
- 205 S Lincoln St
- 1031 W A St
- 220 Fernwood Way
Your Personal Tour Guide
Ask me questions while you tour the home.