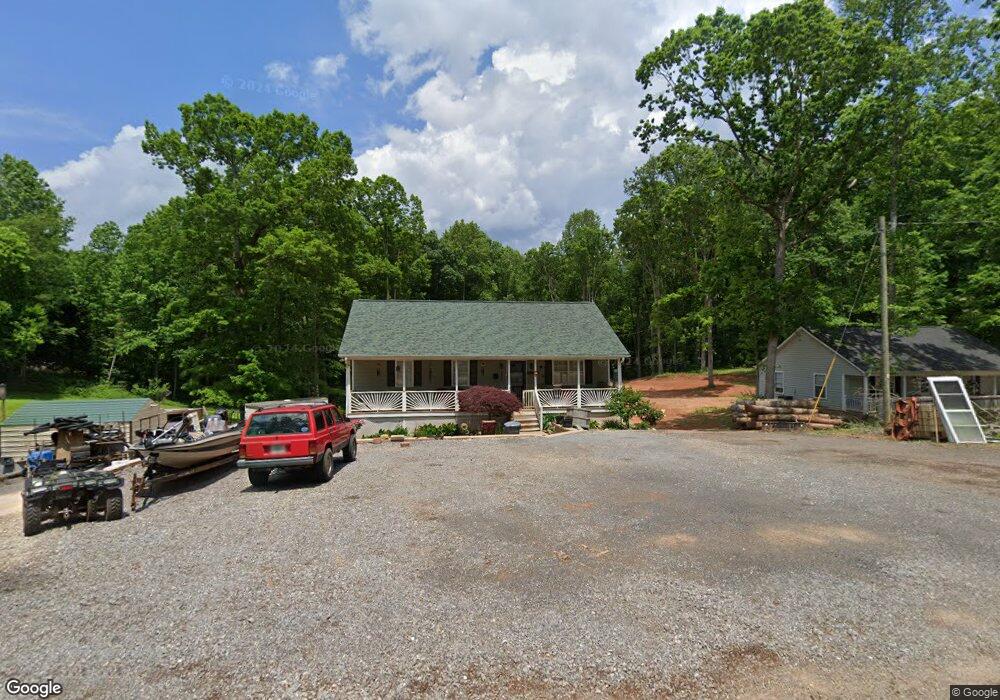
220 Green Farm St Jasper, GA 30143
Estimated Value: $293,000 - $345,000
3
Beds
2
Baths
1,092
Sq Ft
$292/Sq Ft
Est. Value
About This Home
This home is located at 220 Green Farm St, Jasper, GA 30143 and is currently estimated at $318,667, approximately $291 per square foot. 220 Green Farm St is a home located in Pickens County with nearby schools including Tate Elementary School, Pickens County Middle School, and Pickens County High School.
Ownership History
Date
Name
Owned For
Owner Type
Purchase Details
Closed on
Mar 13, 2007
Sold by
Worsham Douglas G
Bought by
Pendley David G
Current Estimated Value
Home Financials for this Owner
Home Financials are based on the most recent Mortgage that was taken out on this home.
Original Mortgage
$113,600
Outstanding Balance
$68,723
Interest Rate
6.25%
Mortgage Type
New Conventional
Estimated Equity
$249,944
Purchase Details
Closed on
Oct 31, 2002
Sold by
Millsap Lisa
Bought by
Worsham Douglas G
Purchase Details
Closed on
Mar 8, 2001
Bought by
Millsap Brian K and Millsap Lisa
Purchase Details
Closed on
Jul 31, 1997
Sold by
Walker Charles Mark
Bought by
Millsap Lisa
Purchase Details
Closed on
Sep 15, 1995
Bought by
Walker Charles Mark
Purchase Details
Closed on
Jul 10, 1995
Bought by
Roland Tim
Purchase Details
Closed on
Nov 4, 1994
Bought by
Roland Tim and Bobby Bates
Create a Home Valuation Report for This Property
The Home Valuation Report is an in-depth analysis detailing your home's value as well as a comparison with similar homes in the area
Home Values in the Area
Average Home Value in this Area
Purchase History
| Date | Buyer | Sale Price | Title Company |
|---|---|---|---|
| Pendley David G | $142,000 | -- | |
| Worsham Douglas G | $130,200 | -- | |
| Millsap Brian K | -- | -- | |
| Millsap Lisa | $78,000 | -- | |
| Walker Charles Mark | $70,000 | -- | |
| Roland Tim | -- | -- | |
| Roland Tim | $22,000 | -- |
Source: Public Records
Mortgage History
| Date | Status | Borrower | Loan Amount |
|---|---|---|---|
| Open | Pendley David G | $113,600 | |
| Closed | Pendley David G | $28,400 |
Source: Public Records
Tax History Compared to Growth
Tax History
| Year | Tax Paid | Tax Assessment Tax Assessment Total Assessment is a certain percentage of the fair market value that is determined by local assessors to be the total taxable value of land and additions on the property. | Land | Improvement |
|---|---|---|---|---|
| 2024 | $2,278 | $120,110 | $14,000 | $106,110 |
| 2023 | $1,676 | $87,406 | $14,000 | $73,406 |
| 2022 | $1,676 | $87,406 | $14,000 | $73,406 |
| 2021 | $1,059 | $53,615 | $14,000 | $39,615 |
| 2020 | $1,091 | $53,615 | $14,000 | $39,615 |
| 2019 | $1,116 | $53,615 | $14,000 | $39,615 |
| 2018 | $1,127 | $53,615 | $14,000 | $39,615 |
| 2017 | $1,145 | $53,615 | $14,000 | $39,615 |
| 2016 | $1,163 | $53,615 | $14,000 | $39,615 |
| 2015 | $1,136 | $53,615 | $14,000 | $39,615 |
| 2014 | $1,139 | $53,615 | $14,000 | $39,615 |
| 2013 | -- | $53,614 | $14,000 | $39,614 |
Source: Public Records
Map
Nearby Homes
- 316 Kimberleys Crossing
- 206 Worley Dr
- 48 Worley Ct
- 56 Preserve Point
- 0 Highway 515 Unit 10177790
- 265 Green School Rd
- 99 Mulberry Cir
- 00 Highway 515 S
- 444 Laiken Dr
- 98 Ivy Ridge Dr
- 89 Paul Cir
- 175 Laiken Dr
- 97 Crossroad Cir
- 380 Riverstone Way
- 358 Cagle Mill Rd N
- 2 Highway 53
- The Maddux II Plan at Summit at Gateway
- The Ellison II Plan at Summit at Gateway
- The Norwood II Plan at Summit at Gateway
- 405 Thrasher Ln
- 196 Green Farm St
- 0 Green Farm St Unit 7211831
- 0 Green Farm St Unit 7593060
- 0 Green Farm St Unit 7302737
- 0 Green Farm St
- 240 Green Farm St
- 148 Green Farm St
- 278 Green Farm St
- 269 Green Farm St
- 124 Green Farm St
- 300 Kimberleys Crossing
- 110 Green Farm St
- 279 Green Farm St
- 296 Green Farm St
- 291 Green Farm St
- 94 Green Farm St
- 326 Kimberleys Crossing
- 345 Kimberleys Crossing
- 307 Green Farm St
- 182 Kimberleys Crossing