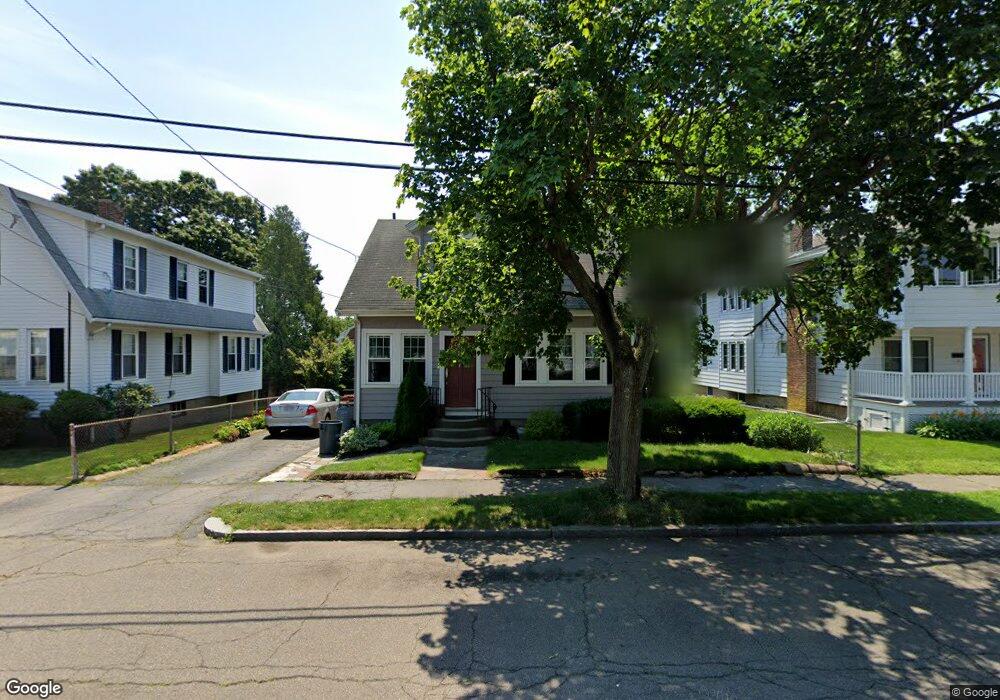
220 Holbrook Rd Quincy, MA 02171
Montclair NeighborhoodEstimated Value: $762,000 - $905,000
3
Beds
3
Baths
1,900
Sq Ft
$432/Sq Ft
Est. Value
About This Home
This home is located at 220 Holbrook Rd, Quincy, MA 02171 and is currently estimated at $820,173, approximately $431 per square foot. 220 Holbrook Rd is a home located in Norfolk County with nearby schools including Montclair Elementary School, Atlantic Middle School, and North Quincy High School.
Ownership History
Date
Name
Owned For
Owner Type
Purchase Details
Closed on
Jun 30, 2003
Sold by
Dubois Daniel H and Dubois Tricia G
Bought by
Edgerly Douglas R and Edgerly Deborah A
Current Estimated Value
Home Financials for this Owner
Home Financials are based on the most recent Mortgage that was taken out on this home.
Original Mortgage
$190,000
Outstanding Balance
$82,420
Interest Rate
5.53%
Mortgage Type
Purchase Money Mortgage
Estimated Equity
$737,753
Purchase Details
Closed on
Mar 13, 1998
Sold by
Patch Russell C and Patch Mabel S
Bought by
Dubois Daniel H and Dubois Tricia G
Home Financials for this Owner
Home Financials are based on the most recent Mortgage that was taken out on this home.
Original Mortgage
$166,155
Interest Rate
7.03%
Mortgage Type
Purchase Money Mortgage
Create a Home Valuation Report for This Property
The Home Valuation Report is an in-depth analysis detailing your home's value as well as a comparison with similar homes in the area
Home Values in the Area
Average Home Value in this Area
Purchase History
| Date | Buyer | Sale Price | Title Company |
|---|---|---|---|
| Edgerly Douglas R | $385,000 | -- | |
| Dubois Daniel H | $174,900 | -- | |
| Dubois Daniel H | $174,900 | -- |
Source: Public Records
Mortgage History
| Date | Status | Borrower | Loan Amount |
|---|---|---|---|
| Open | Edgerly Douglas R | $190,000 | |
| Previous Owner | Dubois Daniel H | $85,000 | |
| Previous Owner | Dubois Daniel H | $166,155 |
Source: Public Records
Tax History Compared to Growth
Tax History
| Year | Tax Paid | Tax Assessment Tax Assessment Total Assessment is a certain percentage of the fair market value that is determined by local assessors to be the total taxable value of land and additions on the property. | Land | Improvement |
|---|---|---|---|---|
| 2025 | $7,950 | $689,500 | $364,100 | $325,400 |
| 2024 | $7,739 | $686,700 | $364,100 | $322,600 |
| 2023 | $7,219 | $648,600 | $346,800 | $301,800 |
| 2022 | $7,129 | $595,100 | $301,500 | $293,600 |
| 2021 | $6,841 | $563,500 | $287,200 | $276,300 |
| 2020 | $6,938 | $558,200 | $287,200 | $271,000 |
| 2019 | $6,373 | $507,800 | $268,400 | $239,400 |
| 2018 | $6,385 | $478,600 | $248,500 | $230,100 |
| 2017 | $6,291 | $444,000 | $236,700 | $207,300 |
| 2016 | $5,875 | $409,100 | $205,800 | $203,300 |
| 2015 | $5,355 | $366,800 | $187,100 | $179,700 |
| 2014 | $4,977 | $334,900 | $178,200 | $156,700 |
Source: Public Records
Map
Nearby Homes
- 51 Denmark Ave
- 115 W Squantum St Unit 907
- 115 W Squantum St Unit 810
- 129-131 Pine St
- 204 Farrington St
- 169 Pine St
- 171 Milton St
- 143 Arlington St
- 17 Holmes St Unit 2
- 17 Holmes St Unit 4
- 11 Rockwell Ave
- 250 Fayette St
- 55 Christopher Dr
- 121 Hillside Ave
- 323 Farrington St
- 522 Hancock St
- 129 Beale St
- 71 Cabot St
- 60 Pond St
- 45 Marion St
- 216 Holbrook Rd
- 222 Holbrook Rd Unit 1
- 224 Holbrook Rd Unit 2
- 212 Holbrook Rd
- 228 Holbrook Rd
- 127 Elliot Ave
- 125 Elliot Ave
- 131 Elliot Ave
- 208 Holbrook Rd
- 121 Elliot Ave
- 135 Elliot Ave
- 232 Holbrook Rd
- 31 Bowdoin St
- 217 Holbrook Rd
- 221 Holbrook Rd
- 117 Elliot Ave
- 215 Holbrook Rd
- 204 Holbrook Rd
- 225 Holbrook Rd
- 211 Holbrook Rd