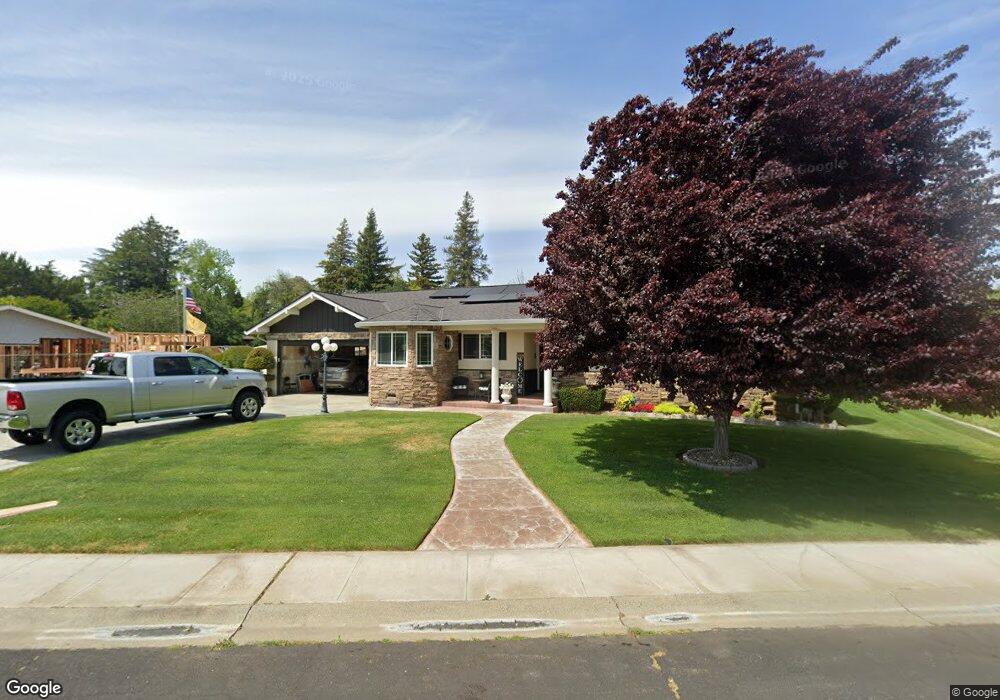
220 Peach Tree Ave Vacaville, CA 95688
Estimated Value: $615,000 - $821,280
3
Beds
2
Baths
1,883
Sq Ft
$382/Sq Ft
Est. Value
About This Home
This home is located at 220 Peach Tree Ave, Vacaville, CA 95688 and is currently estimated at $719,070, approximately $381 per square foot. 220 Peach Tree Ave is a home located in Solano County with nearby schools including Alamo Elementary School, Orchard Elementary School, and Willis Jepson Middle School.
Ownership History
Date
Name
Owned For
Owner Type
Purchase Details
Closed on
Feb 20, 2007
Sold by
Oakes Merton D and Oakes Sheila
Bought by
Oakes Merton Dale and Oakes Sheila
Current Estimated Value
Purchase Details
Closed on
Nov 10, 2004
Sold by
Oakes Merton D
Bought by
Oakes Merton D and Oakes Sheila
Purchase Details
Closed on
Sep 10, 2004
Sold by
Oakes Sheila
Bought by
Oakes Merton D
Home Financials for this Owner
Home Financials are based on the most recent Mortgage that was taken out on this home.
Original Mortgage
$195,000
Outstanding Balance
$90,890
Interest Rate
5%
Mortgage Type
Purchase Money Mortgage
Estimated Equity
$628,180
Purchase Details
Closed on
Jul 21, 1998
Sold by
Paulazzo Gilbert
Bought by
Oakes Merton D and Oakes Sheila
Home Financials for this Owner
Home Financials are based on the most recent Mortgage that was taken out on this home.
Original Mortgage
$181,280
Interest Rate
7.01%
Mortgage Type
VA
Create a Home Valuation Report for This Property
The Home Valuation Report is an in-depth analysis detailing your home's value as well as a comparison with similar homes in the area
Purchase History
| Date | Buyer | Sale Price | Title Company |
|---|---|---|---|
| Oakes Merton Dale | -- | Alliance Title Company | |
| Oakes Merton D | -- | Fidelity National Title Co | |
| Oakes Merton D | -- | Fidelity Title Co | |
| Oakes Merton D | $176,000 | -- |
Source: Public Records
Mortgage History
| Date | Status | Borrower | Loan Amount |
|---|---|---|---|
| Open | Oakes Merton D | $195,000 | |
| Closed | Oakes Merton D | $181,280 |
Source: Public Records
Tax History
| Year | Tax Paid | Tax Assessment Tax Assessment Total Assessment is a certain percentage of the fair market value that is determined by local assessors to be the total taxable value of land and additions on the property. | Land | Improvement |
|---|---|---|---|---|
| 2025 | $5,241 | $462,830 | $78,380 | $384,450 |
| 2024 | $5,241 | $453,756 | $76,844 | $376,912 |
| 2023 | $5,116 | $444,860 | $75,338 | $369,522 |
| 2022 | $4,981 | $436,138 | $73,861 | $362,277 |
| 2021 | $4,989 | $427,587 | $72,413 | $355,174 |
| 2020 | $4,922 | $423,204 | $71,671 | $351,533 |
| 2019 | $4,835 | $414,907 | $70,266 | $344,641 |
| 2018 | $4,780 | $406,773 | $68,889 | $337,884 |
| 2017 | $4,620 | $398,798 | $67,539 | $331,259 |
| 2016 | $4,597 | $390,979 | $66,215 | $324,764 |
| 2015 | $4,537 | $385,107 | $65,221 | $319,886 |
| 2014 | $4,249 | $377,564 | $63,944 | $313,620 |
Source: Public Records
Map
Nearby Homes
- 456 Lovers Ln
- 149 Mason St
- 0 Merchant St Unit 325089259
- 0 Parker St Unit 324045416
- 481 S Orchard Ave
- 365 Acacia St
- 308 Buckeye St
- 239 Deodara St
- 512 Davis St
- 620 Walnut Ave
- 317 Grape St
- 451 Alamo Dr
- 701 Catherine St
- 707 Catherine St
- 713 Catherine St
- 901 El Camino Ave
- 719 Catherine St
- 149 Fairoaks Dr
- 3001 Chardonnay Ct
- 729 Brookside Dr
- 240 Peach Tree Ave
- 200 Peach Tree Ave
- 213 Peach Tree Ave Unit 4
- 225 Peach Tree Ave
- 260 Peach Tree Ave
- 237 Peach Tree Ave
- 207 Peach Tree Ave
- 319 Buck Ave
- 321 Buck Ave
- 249 Peach Tree Ave
- 323 Buck Ave
- 313 Buck Ave
- 330 Kentucky St
- 324 Kentucky St
- 325 Buck Ave
- 400 Kentucky St
- 280 Peach Tree Ave
- 309 Buck Ave
- 220 Magnolia Ave
Your Personal Tour Guide
Ask me questions while you tour the home.