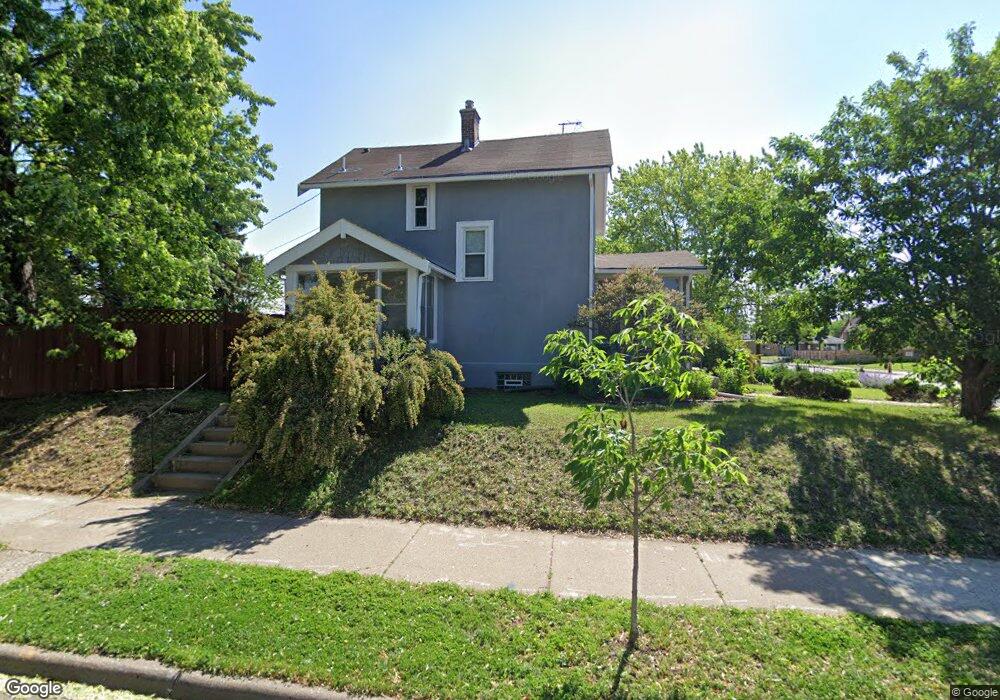
2200 E 38th St Minneapolis, MN 55407
Standish NeighborhoodEstimated Value: $302,000 - $377,000
3
Beds
1
Bath
1,210
Sq Ft
$275/Sq Ft
Est. Value
About This Home
This home is located at 2200 E 38th St, Minneapolis, MN 55407 and is currently estimated at $332,596, approximately $274 per square foot. 2200 E 38th St is a home located in Hennepin County with nearby schools including Andersen United Middle School, Andersen Middle, and South Senior High School.
Ownership History
Date
Name
Owned For
Owner Type
Purchase Details
Closed on
Jan 31, 2019
Sold by
Hp Minnescta I Llc
Bought by
Hpa Jv Borrower 2019-1Ml Llc
Current Estimated Value
Home Financials for this Owner
Home Financials are based on the most recent Mortgage that was taken out on this home.
Original Mortgage
$187,500
Outstanding Balance
$162,239
Interest Rate
3.75%
Mortgage Type
Adjustable Rate Mortgage/ARM
Estimated Equity
$170,357
Purchase Details
Closed on
Aug 28, 2018
Sold by
Raimis Construction Llc
Bought by
Hp Minnesota I Llc
Purchase Details
Closed on
Jan 17, 2018
Sold by
Fannie Mae
Bought by
Ramis Construction Llc
Purchase Details
Closed on
Sep 30, 2005
Sold by
Collette Todd L and Collette Amy
Bought by
Not Provided
Purchase Details
Closed on
Jun 26, 2001
Sold by
Taylor Marlos M and Taylor David
Bought by
Collette Todd L
Purchase Details
Closed on
Jul 3, 1997
Sold by
Norine William L and Norine Siri
Bought by
Lewis Marlos M
Create a Home Valuation Report for This Property
The Home Valuation Report is an in-depth analysis detailing your home's value as well as a comparison with similar homes in the area
Home Values in the Area
Average Home Value in this Area
Purchase History
| Date | Buyer | Sale Price | Title Company |
|---|---|---|---|
| Hpa Jv Borrower 2019-1Ml Llc | -- | Stewart Title | |
| Hp Minnesota I Llc | $247,500 | Burnet Title | |
| Ramis Construction Llc | -- | First Financial Title Agency | |
| Not Provided | $184,899 | -- | |
| Collette Todd L | $126,000 | -- | |
| Lewis Marlos M | $64,900 | -- |
Source: Public Records
Mortgage History
| Date | Status | Borrower | Loan Amount |
|---|---|---|---|
| Open | Hpa Jv Borrower 2019-1Ml Llc | $187,500 |
Source: Public Records
Tax History Compared to Growth
Tax History
| Year | Tax Paid | Tax Assessment Tax Assessment Total Assessment is a certain percentage of the fair market value that is determined by local assessors to be the total taxable value of land and additions on the property. | Land | Improvement |
|---|---|---|---|---|
| 2024 | $5,098 | $329,000 | $102,000 | $227,000 |
| 2023 | $4,592 | $335,000 | $93,000 | $242,000 |
| 2022 | $3,838 | $319,000 | $74,000 | $245,000 |
| 2021 | $3,308 | $277,000 | $44,000 | $233,000 |
| 2020 | $3,408 | $247,000 | $49,300 | $197,700 |
| 2019 | $2,681 | $235,000 | $27,900 | $207,100 |
| 2018 | $2,255 | $179,500 | $27,900 | $151,600 |
| 2017 | $2,018 | $149,500 | $25,400 | $124,100 |
| 2016 | $1,845 | $135,500 | $25,400 | $110,100 |
| 2015 | $1,935 | $135,500 | $25,400 | $110,100 |
| 2014 | -- | $129,000 | $25,400 | $103,600 |
Source: Public Records
Map
Nearby Homes
- 3852 22nd Ave S
- 3729 19th Ave S
- 3641 19th Ave S
- 2210 E 40th St Unit 215
- 3936 21st Ave S
- 3813 Longfellow Ave
- 3656 26th Ave S
- 3847 Cedar Ave S
- 3924 Longfellow Ave
- 3501 22nd Ave S
- 4004 19th Ave S
- 1911 E 35th St
- 3712 18th Ave S
- 4105 21st Ave S
- 3501 Cedar Ave S
- 3520 27th Ave S
- 4125 23rd Ave S
- 4129 23rd Ave S
- 3434 26th Ave S
- 3951 17th Ave S
- 2204 E 38th St
- 2208 E 38th St
- 3739 22nd Ave S
- 3735 22nd Ave S
- 2216 E 38th St
- 3746 22nd Ave S
- 2203 E 38th St
- 3731 22nd Ave S
- 3740 22nd Ave S
- 2211 E 38th St
- 3738 Standish Ave
- 3734 22nd Ave S
- 2220 E 38th St
- 3727 22nd Ave S
- 3804 22nd Ave S
- 3734 Standish Ave
- 3809 22nd Ave S
- 3730 22nd Ave S
- 2213 E 38th St
- 3730 Standish Ave