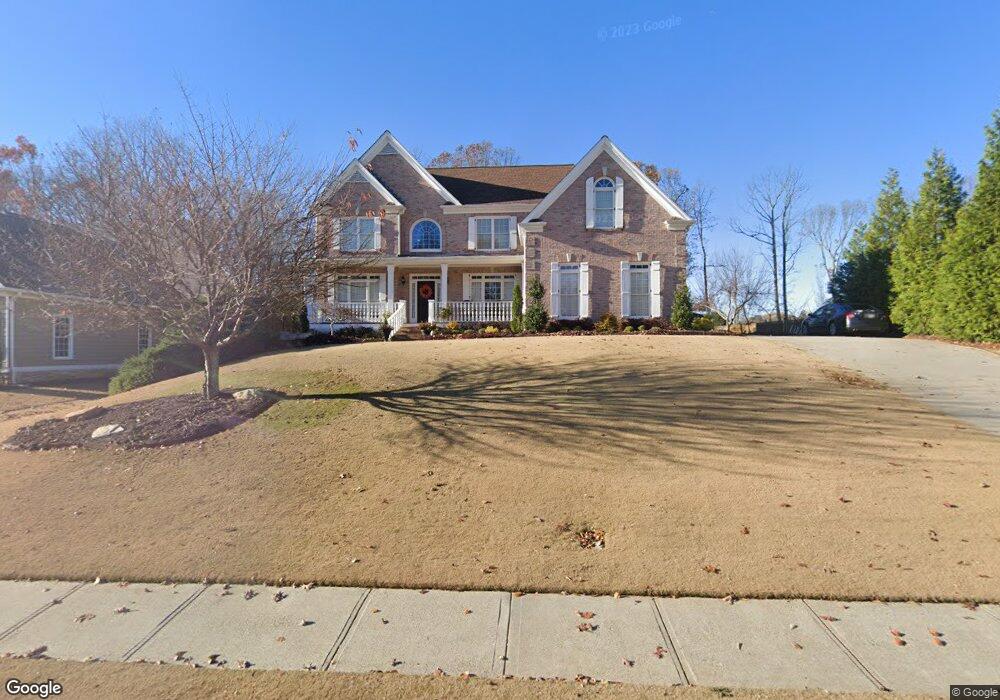
2200 Misty Oaks Dr Buford, GA 30519
Estimated Value: $583,000 - $650,000
4
Beds
4
Baths
3,546
Sq Ft
$173/Sq Ft
Est. Value
About This Home
This home is located at 2200 Misty Oaks Dr, Buford, GA 30519 and is currently estimated at $613,097, approximately $172 per square foot. 2200 Misty Oaks Dr is a home located in Gwinnett County with nearby schools including Harmony Elementary School and Glenn C. Jones Middle School.
Ownership History
Date
Name
Owned For
Owner Type
Purchase Details
Closed on
Jun 30, 2008
Sold by
Chitty Charles R
Bought by
West Plez and West Angela
Current Estimated Value
Home Financials for this Owner
Home Financials are based on the most recent Mortgage that was taken out on this home.
Original Mortgage
$256,000
Outstanding Balance
$164,229
Interest Rate
5.96%
Mortgage Type
New Conventional
Estimated Equity
$448,868
Purchase Details
Closed on
Sep 7, 2007
Sold by
Hall Eric N and Hall Stephanie L
Bought by
Waldron Phillip C
Home Financials for this Owner
Home Financials are based on the most recent Mortgage that was taken out on this home.
Original Mortgage
$312,000
Interest Rate
8.13%
Mortgage Type
New Conventional
Purchase Details
Closed on
Sep 22, 2000
Sold by
Four Points Builders Inc
Bought by
Hall Eric N and Hall Stephanie L
Home Financials for this Owner
Home Financials are based on the most recent Mortgage that was taken out on this home.
Original Mortgage
$234,350
Interest Rate
7.92%
Mortgage Type
New Conventional
Create a Home Valuation Report for This Property
The Home Valuation Report is an in-depth analysis detailing your home's value as well as a comparison with similar homes in the area
Home Values in the Area
Average Home Value in this Area
Purchase History
| Date | Buyer | Sale Price | Title Company |
|---|---|---|---|
| West Plez | $320,000 | -- | |
| Waldron Phillip C | $390,000 | -- | |
| Hall Eric N | $293,000 | -- |
Source: Public Records
Mortgage History
| Date | Status | Borrower | Loan Amount |
|---|---|---|---|
| Open | West Plez | $256,000 | |
| Previous Owner | Waldron Phillip C | $312,000 | |
| Previous Owner | Hall Eric N | $234,350 |
Source: Public Records
Tax History Compared to Growth
Tax History
| Year | Tax Paid | Tax Assessment Tax Assessment Total Assessment is a certain percentage of the fair market value that is determined by local assessors to be the total taxable value of land and additions on the property. | Land | Improvement |
|---|---|---|---|---|
| 2024 | $7,838 | $227,240 | $39,600 | $187,640 |
| 2023 | $7,838 | $198,280 | $39,600 | $158,680 |
| 2022 | $7,431 | $198,280 | $39,600 | $158,680 |
| 2021 | $6,270 | $162,920 | $30,720 | $132,200 |
| 2020 | $6,308 | $162,920 | $30,720 | $132,200 |
| 2019 | $6,073 | $162,920 | $30,720 | $132,200 |
| 2018 | $5,460 | $145,040 | $28,000 | $117,040 |
| 2016 | $5,039 | $132,640 | $25,600 | $107,040 |
| 2015 | $4,557 | $117,440 | $18,400 | $99,040 |
| 2014 | $4,298 | $109,480 | $18,400 | $91,080 |
Source: Public Records
Map
Nearby Homes
- 3600 Devenwood Way
- 190 Maddox Rd
- 2398 E Maddox Rd
- 3684 Heritage Crest Pkwy
- 2101 E Maddox Rd
- 2361 Black Bear Ct Unit 2
- 2446 Thrasher Rd
- 2040 Harvest Ridge Cir
- 2040 Harvest Ridge Cir NE
- 4316 Woodland Bank Blvd
- 2183 Ivy Crest Dr
- 2140 Harvest Ridge Cir
- 4017 S South Bogan Rd
- 2551 E Maddox Rd
- 4245 Woodland Bank Blvd
- 4041 Lost Mill Ln
- 2692 Bogan Creek Dr
- 3476 Harvest Ridge Ln
- 3685 Rolling Creek Dr
- 0 Misty Oaks Dr Unit 7293526
- 0 Misty Oaks Dr Unit 7475706
- 0 Misty Oaks Dr Unit 7341548
- 0 Misty Oaks Dr Unit 7327128
- 0 Misty Oaks Dr Unit 7263839
- 0 Misty Oaks Dr Unit 7224788
- 0 Misty Oaks Dr Unit 7155068
- 0 Misty Oaks Dr Unit 3200432
- 0 Misty Oaks Dr Unit 3203657
- 0 Misty Oaks Dr Unit 3153397
- 0 Misty Oaks Dr Unit 8237274
- 0 Misty Oaks Dr Unit 8171825
- 0 Misty Oaks Dr Unit 8110786
- 0 Misty Oaks Dr Unit 7339782
- 0 Misty Oaks Dr
- 2190 Misty Oaks Dr
- 2205 Misty Oaks Dr
- 2210 Misty Oaks Dr
- 2180 Misty Oaks Dr
- 2195 Misty Oaks Dr Unit 2