The Westlee 2200 N Westmoreland St Unit 322 Arlington, VA 22213
East Falls Church NeighborhoodEstimated Value: $450,104 - $518,000
1
Bed
1
Bath
870
Sq Ft
$550/Sq Ft
Est. Value
About This Home
This home is located at 2200 N Westmoreland St Unit 322, Arlington, VA 22213 and is currently estimated at $478,526, approximately $550 per square foot. 2200 N Westmoreland St Unit 322 is a home located in Arlington County with nearby schools including Tuckahoe Elementary School, Williamsburg Middle School, and Yorktown High School.
Ownership History
Date
Name
Owned For
Owner Type
Purchase Details
Closed on
Aug 19, 2011
Sold by
Matsumoto Blair S
Bought by
He Shuixian
Current Estimated Value
Home Financials for this Owner
Home Financials are based on the most recent Mortgage that was taken out on this home.
Original Mortgage
$227,300
Outstanding Balance
$157,453
Interest Rate
4.58%
Mortgage Type
VA
Estimated Equity
$321,073
Purchase Details
Closed on
Nov 19, 2008
Sold by
Galbraith Matthew D
Bought by
Matsumoto Blair S and Mcmahon Karen K
Home Financials for this Owner
Home Financials are based on the most recent Mortgage that was taken out on this home.
Original Mortgage
$369,138
Interest Rate
6.03%
Mortgage Type
FHA
Purchase Details
Closed on
Oct 23, 2006
Sold by
Rose 70Ksf Llc
Bought by
Galbraith Matthew
Home Financials for this Owner
Home Financials are based on the most recent Mortgage that was taken out on this home.
Original Mortgage
$15,800
Interest Rate
6.47%
Mortgage Type
Future Advance Clause Open End Mortgage
Create a Home Valuation Report for This Property
The Home Valuation Report is an in-depth analysis detailing your home's value as well as a comparison with similar homes in the area
Home Values in the Area
Average Home Value in this Area
Purchase History
| Date | Buyer | Sale Price | Title Company |
|---|---|---|---|
| He Shuixian | $361,000 | -- | |
| Matsumoto Blair S | $383,000 | -- | |
| Galbraith Matthew | $375,634 | -- |
Source: Public Records
Mortgage History
| Date | Status | Borrower | Loan Amount |
|---|---|---|---|
| Open | He Shuixian | $227,300 | |
| Previous Owner | Matsumoto Blair S | $369,138 | |
| Previous Owner | Galbraith Matthew | $15,800 | |
| Previous Owner | Galbraith Matthew | $300,507 |
Source: Public Records
Tax History Compared to Growth
Tax History
| Year | Tax Paid | Tax Assessment Tax Assessment Total Assessment is a certain percentage of the fair market value that is determined by local assessors to be the total taxable value of land and additions on the property. | Land | Improvement |
|---|---|---|---|---|
| 2025 | $4,590 | $444,300 | $74,400 | $369,900 |
| 2024 | $4,453 | $431,100 | $74,400 | $356,700 |
| 2023 | $4,440 | $431,100 | $74,400 | $356,700 |
| 2022 | $4,373 | $424,600 | $74,400 | $350,200 |
| 2021 | $4,441 | $431,200 | $74,400 | $356,800 |
| 2020 | $4,144 | $403,900 | $38,500 | $365,400 |
| 2019 | $3,978 | $387,700 | $38,500 | $349,200 |
| 2018 | $3,852 | $382,900 | $38,500 | $344,400 |
| 2017 | $3,790 | $376,700 | $38,500 | $338,200 |
| 2016 | $3,733 | $376,700 | $38,500 | $338,200 |
| 2015 | $3,752 | $376,700 | $38,500 | $338,200 |
| 2014 | $3,721 | $373,600 | $38,500 | $335,100 |
Source: Public Records
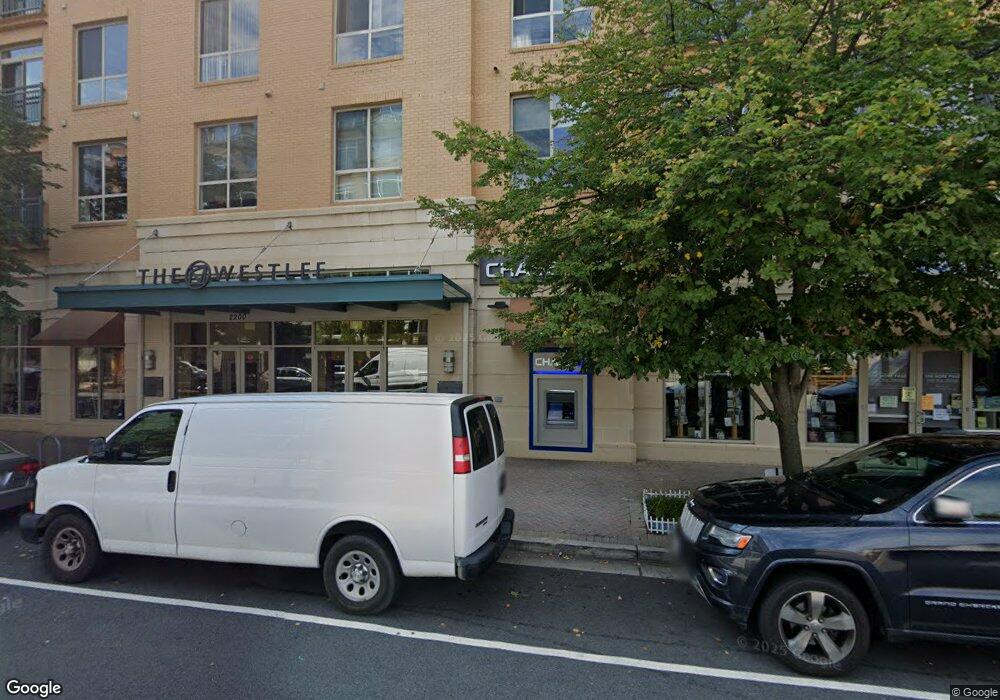
About The Westlee
Map
Nearby Homes
- 2200 N Westmoreland St Unit 516
- 2200 N Westmoreland St Unit 202
- 6924 Fairfax Dr Unit 122
- 1922 N Van Buren St
- 1933 N Van Buren St
- 6701 Washington Blvd Unit B
- 1800 N Tuckahoe St
- 2315 N Tuckahoe St
- 200 N Maple Ave Unit 416
- 6314 Washington Blvd
- 2828 N Van Buren St
- 6282 15th Rd N
- 1007 N Sycamore St
- 1008 N Roosevelt St
- 1000 N Sycamore St
- 6243 22nd Rd N
- 6607 29th St N
- 221 Gundry Dr
- 2632 N Sycamore St
- 911 Hillwood Ave
- 2200 N Westmoreland St Unit CNVSP
- 2200 N Westmoreland St Unit C
- 2200 N Westmoreland St
- 2200 N Westmoreland St Unit 424
- 2200 N Westmoreland St Unit 507
- 2200 N Westmoreland St Unit 410
- 2200 N Westmoreland St Unit 525
- 2200 N Westmoreland St Unit 314
- 2200 N Westmoreland St Unit 503
- 2200 N Westmoreland St Unit 228
- 2200 N Westmoreland St Unit 331
- 2200 N Westmoreland St Unit 509
- 2200 N Westmoreland St Unit 413
- 2200 N Westmoreland St Unit 225
- 2200 N Westmoreland St Unit 406
- 2200 N Westmoreland St Unit 201
- 2200 N Westmoreland St Unit 524
- 2200 N Westmoreland St Unit 232
- 2200 N Westmoreland St Unit 317
- 2200 N Westmoreland St Unit 313