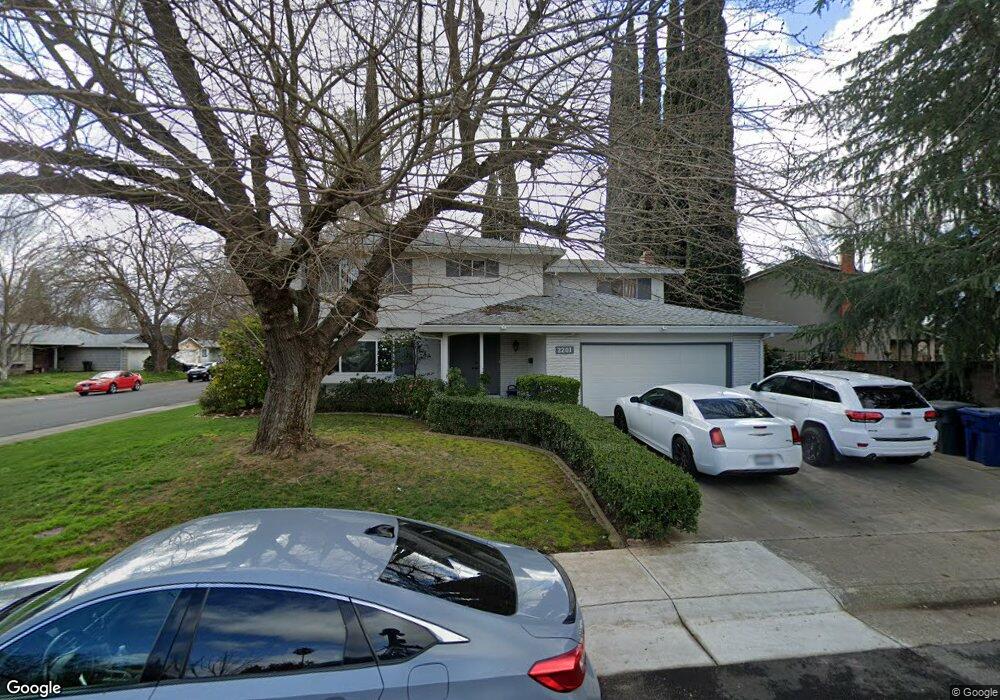
2201 El Canto Cir Rancho Cordova, CA 95670
Cordova Meadows NeighborhoodEstimated Value: $535,000 - $566,000
5
Beds
3
Baths
2,061
Sq Ft
$267/Sq Ft
Est. Value
About This Home
This home is located at 2201 El Canto Cir, Rancho Cordova, CA 95670 and is currently estimated at $550,076, approximately $266 per square foot. 2201 El Canto Cir is a home located in Sacramento County with nearby schools including Cordova Meadows Elementary School, Mills Middle School, and Cordova High School.
Ownership History
Date
Name
Owned For
Owner Type
Purchase Details
Closed on
Nov 20, 2021
Sold by
Johnson Gary R and Johnson Diana G
Bought by
Johnson Gary R and Johnson Diana G
Current Estimated Value
Home Financials for this Owner
Home Financials are based on the most recent Mortgage that was taken out on this home.
Original Mortgage
$270,000
Outstanding Balance
$247,614
Interest Rate
3.05%
Mortgage Type
New Conventional
Estimated Equity
$302,462
Purchase Details
Closed on
Aug 23, 2019
Sold by
Johnson Gary R and Johnson Diana G
Bought by
Johnson Gary R and Johnson Diana G
Home Financials for this Owner
Home Financials are based on the most recent Mortgage that was taken out on this home.
Original Mortgage
$262,500
Interest Rate
3.7%
Mortgage Type
New Conventional
Purchase Details
Closed on
Jun 17, 2019
Sold by
Doherty Thomas L and Trust Of Robert J Doherty Trus
Bought by
Johnson Gary R and Johnson Diana G
Purchase Details
Closed on
Jan 20, 1999
Sold by
Doherty Robert J
Bought by
The Trust Of Robert F Doherty
Create a Home Valuation Report for This Property
The Home Valuation Report is an in-depth analysis detailing your home's value as well as a comparison with similar homes in the area
Home Values in the Area
Average Home Value in this Area
Purchase History
| Date | Buyer | Sale Price | Title Company |
|---|---|---|---|
| Johnson Gary R | -- | First American Title Company | |
| Johnson Gary R | -- | First American Title Company | |
| Johnson Gary R | -- | Accommodation | |
| Johnson Gary R | -- | Bnt Title Company Of Ca | |
| Johnson Gary R | $350,000 | Fidelity National Title Co | |
| The Trust Of Robert F Doherty | -- | -- |
Source: Public Records
Mortgage History
| Date | Status | Borrower | Loan Amount |
|---|---|---|---|
| Open | Johnson Gary R | $270,000 | |
| Closed | Johnson Gary R | $270,000 | |
| Closed | Johnson Gary R | $262,500 |
Source: Public Records
Tax History Compared to Growth
Tax History
| Year | Tax Paid | Tax Assessment Tax Assessment Total Assessment is a certain percentage of the fair market value that is determined by local assessors to be the total taxable value of land and additions on the property. | Land | Improvement |
|---|---|---|---|---|
| 2025 | $5,265 | $446,204 | $111,550 | $334,654 |
| 2024 | $5,265 | $437,456 | $109,363 | $328,093 |
| 2023 | $5,162 | $428,879 | $107,219 | $321,660 |
| 2022 | $5,100 | $420,470 | $105,117 | $315,353 |
| 2021 | $5,002 | $412,226 | $103,056 | $309,170 |
| 2020 | $4,971 | $408,000 | $102,000 | $306,000 |
| 2019 | $1,721 | $139,373 | $21,161 | $118,212 |
| 2018 | $1,676 | $136,642 | $20,747 | $115,895 |
| 2017 | $1,634 | $133,964 | $20,341 | $113,623 |
| 2016 | $1,578 | $131,339 | $19,943 | $111,396 |
| 2015 | $1,500 | $129,367 | $19,644 | $109,723 |
| 2014 | $1,592 | $126,843 | $19,265 | $107,578 |
Source: Public Records
Map
Nearby Homes
- 2446 El Lujo Way
- 2408 El Lujo Way
- 2539 El Burlon Cir
- 2528 El Burlon Cir
- 2433 La Loma Dr
- 2509 La Cumbra Cir
- 2524 Las Casas Way
- 2536 Las Casas Way
- 10000 El Chorlito Dr
- 10204 Malaga Way
- 2722 La Verta Ct
- 2400 E Tiffany Ln
- 2669 Dawes St
- 10343 Holmes Way
- 2240 Chase Dr
- 10357 Daniel Way
- 10335 White Rock Rd
- 9964 Stirling Park Dr
- 10228 Coloma Rd
- 2628 Tronero Way
- 2211 El Canto Cir
- 2274 La Grama Dr
- 2267 La Grama Dr
- 2271 La Grama Dr
- 2258 La Grama Dr
- 2219 El Canto Cir
- 2278 La Grama Dr
- 2275 La Grama Dr
- 2263 La Grama Dr
- 2204 El Canto Cir
- 2208 El Canto Cir
- 2279 La Grama Dr
- 2259 La Grama Dr
- 2223 El Canto Cir
- 2212 El Canto Cir
- 2282 La Grama Dr
- 2254 La Grama Dr
- 2216 El Canto Cir
- 2442 El Lujo Way
- 2440 El Lujo Way