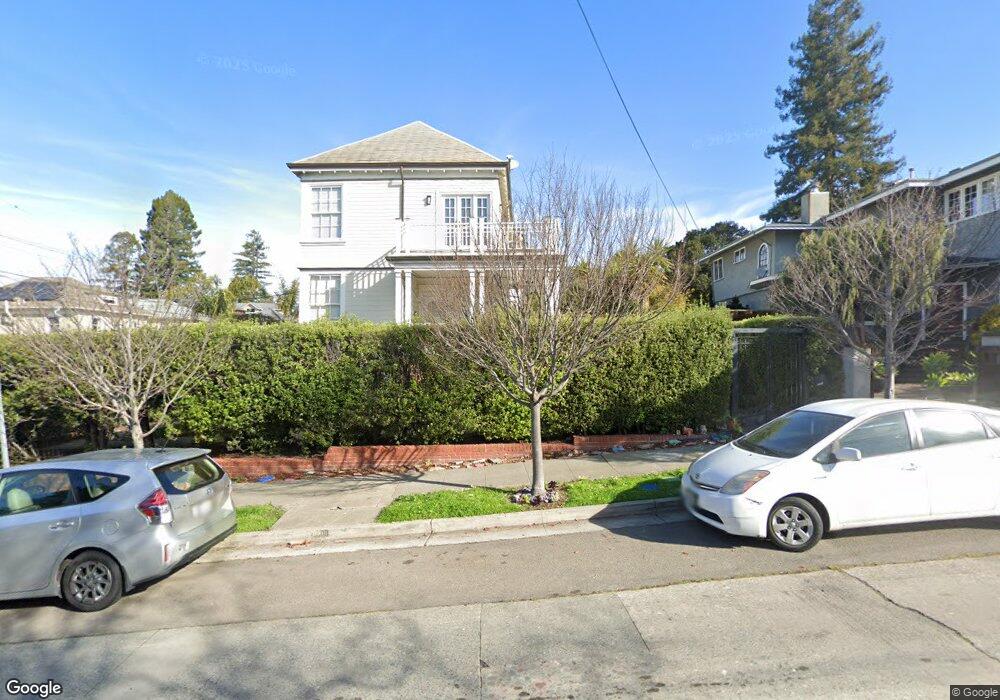
2201 Rose St Berkeley, CA 94709
North Berkeley NeighborhoodEstimated Value: $1,596,000 - $3,447,628
5
Beds
5
Baths
3,116
Sq Ft
$821/Sq Ft
Est. Value
About This Home
This home is located at 2201 Rose St, Berkeley, CA 94709 and is currently estimated at $2,558,157, approximately $820 per square foot. 2201 Rose St is a home located in Alameda County with nearby schools including Berkeley Arts Magnet at Whittier School, Cragmont Elementary School, and Washington Elementary School.
Ownership History
Date
Name
Owned For
Owner Type
Purchase Details
Closed on
Mar 29, 2018
Sold by
Raymond Kenneth N and Raymond Barbara G
Bought by
Raymond Kenneth N and Raymondb Arbara G
Current Estimated Value
Purchase Details
Closed on
Jun 10, 2017
Sold by
Watson Daniel C and Watson Raymond Gabriella
Bought by
Watson Daniel C and Watson Raymond Gabriella
Purchase Details
Closed on
May 23, 2012
Sold by
Red Tower Capital Inc
Bought by
Red Tower Partners I Llc
Home Financials for this Owner
Home Financials are based on the most recent Mortgage that was taken out on this home.
Original Mortgage
$625,500
Outstanding Balance
$432,156
Interest Rate
3.84%
Mortgage Type
New Conventional
Estimated Equity
$2,126,001
Purchase Details
Closed on
May 22, 2012
Sold by
Red Tower Partners I Llc
Bought by
Watson Daniel C and Watson Raymond Gabriella
Home Financials for this Owner
Home Financials are based on the most recent Mortgage that was taken out on this home.
Original Mortgage
$625,500
Outstanding Balance
$432,156
Interest Rate
3.84%
Mortgage Type
New Conventional
Estimated Equity
$2,126,001
Purchase Details
Closed on
Nov 1, 2011
Sold by
Blumenstein Ewers Martina
Bought by
Red Tower Capital Inc
Purchase Details
Closed on
Jun 14, 2007
Sold by
Ewers Altura S
Bought by
Blumenstein Ewers Martina
Home Financials for this Owner
Home Financials are based on the most recent Mortgage that was taken out on this home.
Original Mortgage
$978,500
Interest Rate
6.87%
Mortgage Type
New Conventional
Purchase Details
Closed on
Oct 28, 1998
Sold by
Milberg Aaron S and Milberg Lynn F
Bought by
Ewers Altura S and Blumenstein Ewers Martina
Home Financials for this Owner
Home Financials are based on the most recent Mortgage that was taken out on this home.
Original Mortgage
$520,800
Interest Rate
6.61%
Purchase Details
Closed on
Jun 3, 1994
Sold by
Milberg Aaron S
Bought by
Milberg Lynn F
Create a Home Valuation Report for This Property
The Home Valuation Report is an in-depth analysis detailing your home's value as well as a comparison with similar homes in the area
Home Values in the Area
Average Home Value in this Area
Purchase History
| Date | Buyer | Sale Price | Title Company |
|---|---|---|---|
| Raymond Kenneth N | -- | None Available | |
| Watson Daniel C | -- | None Available | |
| Red Tower Partners I Llc | -- | Old Republic Title Company | |
| Watson Daniel C | $1,232,500 | Old Republic Title Company | |
| Red Tower Capital Inc | $700,000 | Accommodation | |
| Blumenstein Ewers Martina | -- | Stewart Title | |
| Ewers Altura S | $651,000 | Placer Title Company | |
| Milberg Lynn F | -- | First American Title Guarant |
Source: Public Records
Mortgage History
| Date | Status | Borrower | Loan Amount |
|---|---|---|---|
| Open | Watson Daniel C | $625,500 | |
| Previous Owner | Blumenstein Ewers Martina | $978,500 | |
| Previous Owner | Ewers Altura S | $520,800 |
Source: Public Records
Tax History
| Year | Tax Paid | Tax Assessment Tax Assessment Total Assessment is a certain percentage of the fair market value that is determined by local assessors to be the total taxable value of land and additions on the property. | Land | Improvement |
|---|---|---|---|---|
| 2025 | $24,722 | $1,548,007 | $464,339 | $1,083,668 |
| 2024 | $24,722 | $1,517,663 | $455,237 | $1,062,426 |
| 2023 | $24,720 | $1,487,910 | $446,312 | $1,041,598 |
| 2022 | $23,745 | $1,458,737 | $437,562 | $1,021,175 |
| 2021 | $24,288 | $1,430,143 | $428,985 | $1,001,158 |
| 2020 | $22,441 | $1,415,488 | $424,589 | $990,899 |
| 2019 | $21,486 | $1,387,745 | $416,267 | $971,478 |
| 2018 | $21,116 | $1,360,544 | $408,108 | $952,436 |
| 2017 | $20,390 | $1,333,872 | $400,107 | $933,765 |
| 2016 | $19,703 | $1,307,718 | $392,262 | $915,456 |
| 2015 | $19,437 | $1,288,085 | $386,373 | $901,712 |
| 2014 | $19,503 | $1,262,855 | $378,805 | $884,050 |
Source: Public Records
Map
Nearby Homes
- 1444 Walnut St
- 2121 Eunice St
- 1515 Oxford St Unit 1D
- 2315 Eunice St
- 1408 Henry St
- 2501 Rose Walk
- 1622 Scenic Ave
- 2421 Hilgard Ave
- 1682 Oxford St
- 2301 Virginia St Unit 1
- 2201 Virginia St Unit 2
- 1425 Martin Luther King jr Way
- 1950 Hopkins St
- 2340 Virginia St
- 2477 Virginia St
- 1610 Milvia St
- 1841 Vine St
- 2686 Shasta Rd
- 1609 Bonita Ave Unit 5
- 1739 Spruce St
Your Personal Tour Guide
Ask me questions while you tour the home.