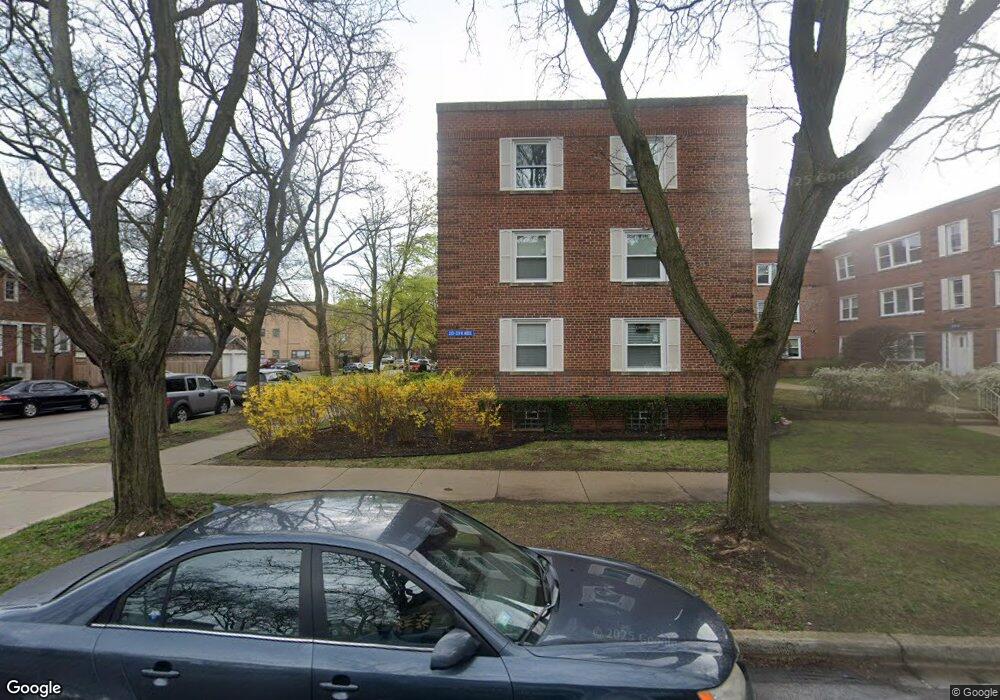
2201 W Morse Ave Unit 2N Chicago, IL 60645
West Ridge NeighborhoodEstimated Value: $139,000 - $165,000
2
Beds
1
Bath
22,680
Sq Ft
$7/Sq Ft
Est. Value
About This Home
This home is located at 2201 W Morse Ave Unit 2N, Chicago, IL 60645 and is currently estimated at $156,255, approximately $6 per square foot. 2201 W Morse Ave Unit 2N is a home located in Cook County with nearby schools including George Armstrong Elementary School, Sullivan High School, and God's Battle Axe Prayer Academy.
Ownership History
Date
Name
Owned For
Owner Type
Purchase Details
Closed on
Dec 17, 2010
Sold by
Winged Foot Investments Inc
Bought by
Tran James and Tran Sarah Thi
Current Estimated Value
Home Financials for this Owner
Home Financials are based on the most recent Mortgage that was taken out on this home.
Original Mortgage
$41,500
Outstanding Balance
$28,243
Interest Rate
4.82%
Mortgage Type
New Conventional
Estimated Equity
$128,012
Purchase Details
Closed on
Mar 3, 2010
Sold by
Worrell Frank
Bought by
Winged Foot Investments Inc
Purchase Details
Closed on
Nov 8, 2007
Sold by
Worrell Lori and Worrell Frank
Bought by
Worrell Lori and Worrell Frank
Home Financials for this Owner
Home Financials are based on the most recent Mortgage that was taken out on this home.
Original Mortgage
$75,000
Interest Rate
6.44%
Mortgage Type
New Conventional
Purchase Details
Closed on
May 19, 1997
Sold by
Kelley Barbara Lee
Bought by
Lyons Lori and Worrell Frank
Create a Home Valuation Report for This Property
The Home Valuation Report is an in-depth analysis detailing your home's value as well as a comparison with similar homes in the area
Home Values in the Area
Average Home Value in this Area
Purchase History
| Date | Buyer | Sale Price | Title Company |
|---|---|---|---|
| Tran James | $56,500 | Premier Title | |
| Winged Foot Investments Inc | -- | Premier Title Company | |
| Worrell Lori | -- | Cti | |
| Lyons Lori | $58,500 | Lawyers Title Insurance Corp |
Source: Public Records
Mortgage History
| Date | Status | Borrower | Loan Amount |
|---|---|---|---|
| Open | Tran James | $41,500 | |
| Previous Owner | Worrell Lori | $75,000 |
Source: Public Records
Tax History Compared to Growth
Tax History
| Year | Tax Paid | Tax Assessment Tax Assessment Total Assessment is a certain percentage of the fair market value that is determined by local assessors to be the total taxable value of land and additions on the property. | Land | Improvement |
|---|---|---|---|---|
| 2024 | $1,410 | $12,150 | $2,078 | $10,072 |
| 2023 | $1,353 | $10,001 | $1,663 | $8,338 |
| 2022 | $1,353 | $10,001 | $1,663 | $8,338 |
| 2021 | $1,341 | $9,999 | $1,662 | $8,337 |
| 2020 | $427 | $5,020 | $1,570 | $3,450 |
| 2019 | $430 | $5,569 | $1,570 | $3,999 |
| 2018 | $421 | $5,569 | $1,570 | $3,999 |
| 2017 | $391 | $5,192 | $1,385 | $3,807 |
| 2016 | $540 | $5,192 | $1,385 | $3,807 |
| 2015 | $471 | $5,192 | $1,385 | $3,807 |
| 2014 | $794 | $6,849 | $1,246 | $5,603 |
| 2013 | $767 | $6,849 | $1,246 | $5,603 |
Source: Public Records
Map
Nearby Homes
- 2245 W Farwell Ave Unit 3B
- 2130 W Farwell Ave
- 2217 W Farwell Ave Unit 2B
- 2217 W Farwell Ave Unit 3B
- 2241 W Farwell Ave Unit 2D
- 2243 W Farwell Ave Unit 3D
- 6961 N Oakley Ave Unit 210
- 6827 N Oakley Ave Unit 3C
- 2300 W Farwell Ave Unit 2
- 2322 W Farwell Ave Unit 1W
- 2325 W Farwell Ave Unit 2S
- 2065 W Farwell Ave Unit 20653N
- 2036 W Morse Ave Unit D
- 2101 W Greenleaf Ave
- 2416 W Morse Ave
- 6959 N Ridge Blvd Unit 1C
- 7019 N Ridge Blvd Unit 3B
- 7019 N Ridge Blvd Unit 3A
- 7070 N Ridge Blvd Unit 1A
- 1958 W Morse Ave Unit B
- 2205 W Morse Ave Unit 2E
- 2201 W Morse Ave Unit 22011
- 2205 W Morse Ave Unit 22052
- 2205 W Morse Ave Unit 22051
- 2201 W Morse Ave Unit 22013
- 2203 W Morse Ave Unit 22033
- 2201 W Morse Ave Unit 22012
- 2205 W Morse Ave Unit 22053
- 2203 W Morse Ave Unit 22032
- 2203 W Morse Ave Unit 22031
- 2205 W Morse Ave Unit 3
- 2205 W Morse Ave Unit 1
- 2203 W Morse Ave Unit 3
- 2203 W Morse Ave Unit 2S
- 2201 W Morse Ave Unit 1
- 2205 W Morse Ave
- 2207 W Morse Ave Unit 22071
- 2207 W Morse Ave Unit 22073
- 2207 W Morse Ave Unit 22072
- 2207 W Morse Ave Unit 1