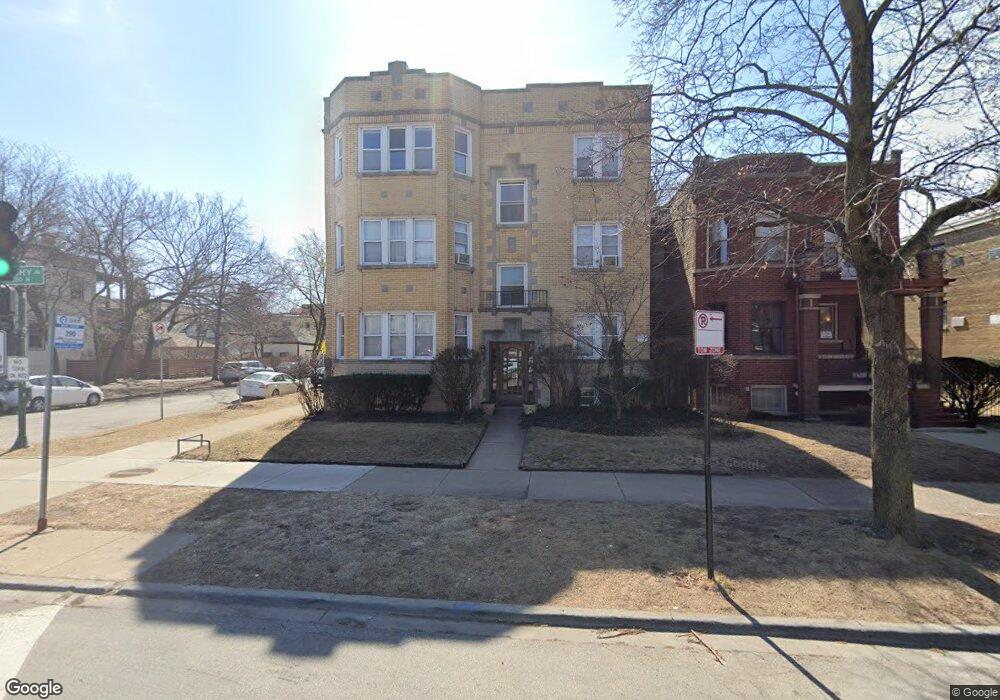
2201 W Touhy Ave Unit 22012 Chicago, IL 60645
West Ridge NeighborhoodEstimated Value: $178,997 - $242,000
2
Beds
1
Bath
900
Sq Ft
$221/Sq Ft
Est. Value
About This Home
This home is located at 2201 W Touhy Ave Unit 22012, Chicago, IL 60645 and is currently estimated at $198,749, approximately $220 per square foot. 2201 W Touhy Ave Unit 22012 is a home located in Cook County with nearby schools including George Armstrong Elementary School, Sullivan High School, and Acero - Sor Juana Ines de la Cruz School.
Ownership History
Date
Name
Owned For
Owner Type
Purchase Details
Closed on
Mar 27, 2017
Sold by
Naeem Ahsan
Bought by
2201 Touhy2 Llc
Current Estimated Value
Purchase Details
Closed on
Oct 3, 2013
Sold by
Markus Ira and Markus Phyllis L
Bought by
Naeem Ahsan
Purchase Details
Closed on
Jul 1, 2007
Sold by
Markus Ira and Markus Phyllis L
Bought by
Markus Ira and Ira Markus Declaration Of Trust
Purchase Details
Closed on
Jun 28, 2002
Sold by
Kochis Stephen G and Kochis Mary Kay
Bought by
Markus Ira and Markus Phyllis L
Purchase Details
Closed on
Sep 23, 1998
Sold by
2201 West Touhy Llc
Bought by
Kochis Stephen and Kochis Mary Kay
Home Financials for this Owner
Home Financials are based on the most recent Mortgage that was taken out on this home.
Original Mortgage
$71,100
Interest Rate
6.99%
Create a Home Valuation Report for This Property
The Home Valuation Report is an in-depth analysis detailing your home's value as well as a comparison with similar homes in the area
Home Values in the Area
Average Home Value in this Area
Purchase History
| Date | Buyer | Sale Price | Title Company |
|---|---|---|---|
| 2201 Touhy2 Llc | -- | None Available | |
| Naeem Ahsan | $105,000 | Proper Title Llc | |
| Markus Ira | -- | None Available | |
| Markus Ira | $140,000 | -- | |
| Kochis Stephen | $86,500 | -- |
Source: Public Records
Mortgage History
| Date | Status | Borrower | Loan Amount |
|---|---|---|---|
| Previous Owner | Kochis Stephen | $71,100 |
Source: Public Records
Tax History Compared to Growth
Tax History
| Year | Tax Paid | Tax Assessment Tax Assessment Total Assessment is a certain percentage of the fair market value that is determined by local assessors to be the total taxable value of land and additions on the property. | Land | Improvement |
|---|---|---|---|---|
| 2024 | $2,665 | $12,794 | $2,016 | $10,778 |
| 2023 | $2,598 | $12,634 | $1,613 | $11,021 |
| 2022 | $2,598 | $12,634 | $1,613 | $11,021 |
| 2021 | $2,540 | $12,633 | $1,612 | $11,021 |
| 2020 | $2,405 | $10,796 | $1,522 | $9,274 |
| 2019 | $2,406 | $11,977 | $1,522 | $10,455 |
| 2018 | $2,366 | $11,977 | $1,522 | $10,455 |
| 2017 | $2,031 | $9,436 | $1,343 | $8,093 |
| 2016 | $1,890 | $9,436 | $1,343 | $8,093 |
| 2015 | $1,729 | $9,436 | $1,343 | $8,093 |
| 2014 | $2,030 | $10,942 | $1,209 | $9,733 |
| 2013 | $1,990 | $10,942 | $1,209 | $9,733 |
Source: Public Records
Map
Nearby Homes
- 2175 W Touhy Ave
- 2224 W Touhy Ave Unit 3N
- 7129 N Oakley Ave
- 7223 N Oakley Ave Unit 1E
- 7234 N Hamilton Ave
- 7252 N Bell Ave
- 7074 N Ridge Blvd Unit 1E
- 2101 W Greenleaf Ave
- 7070 N Ridge Blvd Unit 1A
- 7315 N Oakley Ave Unit 1A
- 7228 N Rogers Ave
- 7344 N Ridge Blvd Unit 5C
- 7348 N Ridge Blvd Unit 16B
- 2109 W Jarvis Ave Unit 1
- 6961 N Oakley Ave Unit 210
- 2424 W Estes Ave Unit 1C
- 2424 W Estes Ave Unit 3B
- 7019 N Ridge Blvd Unit 3B
- 7019 N Ridge Blvd Unit 3A
- 7102 N Damen Ave Unit 3
- 2201 W Touhy Ave Unit 2
- 2201 W Touhy Ave Unit 71282
- 7128 N Bell Ave Unit 71281
- 2201 W Touhy Ave Unit 22011
- 2201 W Touhy Ave Unit 22013
- 2201 W Touhy Ave Unit 71302
- 2201 W Touhy Ave Unit 71301
- 7128 N Bell Ave Unit 71283
- 7128 N Bell Ave Unit 3
- 7128 N Bell Ave Unit 2
- 2201 W Touhy Ave Unit 1
- 7128 N Bell Ave Unit 1
- 2201 W Touhy Ave Unit 3
- 2205 W Touhy Ave
- 7130 N Bell Ave Unit 71303
- 7130 N Bell Ave Unit 2
- 2209 W Touhy Ave
- 2211 W Touhy Ave Unit 6C
- 2213 W Touhy Ave
- 2169 W Touhy Ave