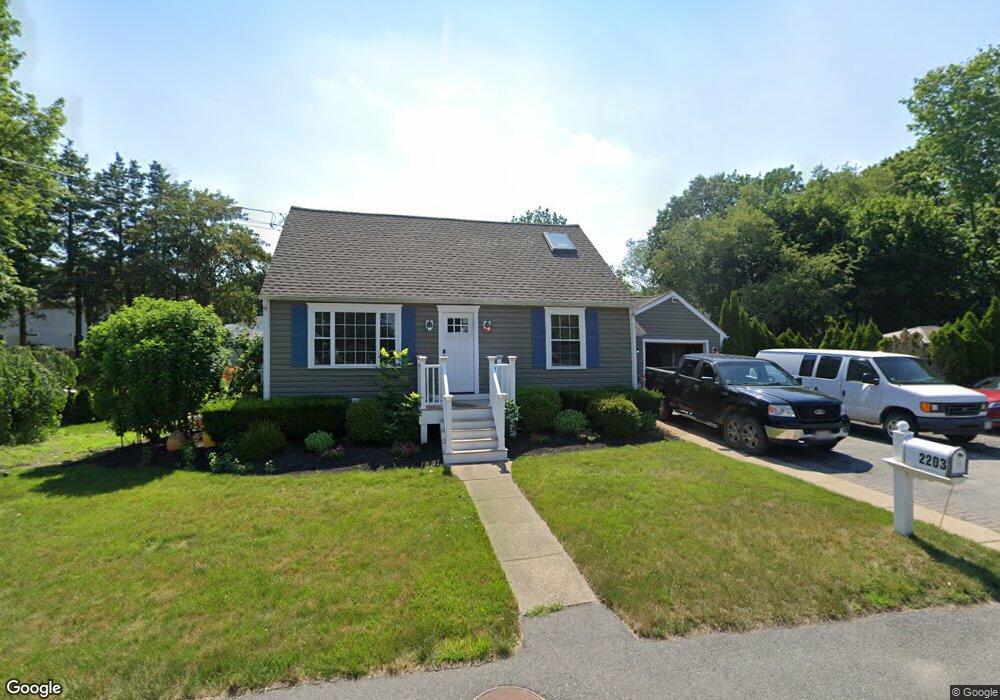
2203 County St Somerset, MA 02726
Pottersville NeighborhoodEstimated Value: $453,454 - $470,000
3
Beds
2
Baths
1,152
Sq Ft
$399/Sq Ft
Est. Value
About This Home
This home is located at 2203 County St, Somerset, MA 02726 and is currently estimated at $459,614, approximately $398 per square foot. 2203 County St is a home located in Bristol County with nearby schools including North Elementary School, Somerset Middle School, and St. Michael's School.
Ownership History
Date
Name
Owned For
Owner Type
Purchase Details
Closed on
Oct 7, 2009
Sold by
Synan James and Citimortgage Inc
Bought by
Gifford Kandace L
Current Estimated Value
Home Financials for this Owner
Home Financials are based on the most recent Mortgage that was taken out on this home.
Original Mortgage
$126,500
Outstanding Balance
$81,846
Interest Rate
5.14%
Mortgage Type
Purchase Money Mortgage
Estimated Equity
$377,768
Purchase Details
Closed on
Feb 21, 2007
Sold by
Synan James and Synan Thomas
Bought by
Synan James
Purchase Details
Closed on
Jul 2, 2004
Sold by
Synan Elizabeth and Synan James
Bought by
Synan Elizabeth and Synan James
Purchase Details
Closed on
Jul 1, 2004
Sold by
Gregoire Emile J and Gregoire Maria A
Bought by
Synan Elizabeth and Synan James
Create a Home Valuation Report for This Property
The Home Valuation Report is an in-depth analysis detailing your home's value as well as a comparison with similar homes in the area
Home Values in the Area
Average Home Value in this Area
Purchase History
| Date | Buyer | Sale Price | Title Company |
|---|---|---|---|
| Gifford Kandace L | $131,691 | -- | |
| Gifford Kandace L | $131,691 | -- | |
| Synan James | -- | -- | |
| Synan James | -- | -- | |
| Synan Elizabeth | -- | -- | |
| Synan Elizabeth | -- | -- | |
| Synan Elizabeth | $239,000 | -- | |
| Synan Elizabeth | $239,000 | -- |
Source: Public Records
Mortgage History
| Date | Status | Borrower | Loan Amount |
|---|---|---|---|
| Open | Gifford Kandace L | $126,500 | |
| Closed | Synan Elizabeth | $8,000 | |
| Closed | Synan Elizabeth | $126,500 |
Source: Public Records
Tax History Compared to Growth
Tax History
| Year | Tax Paid | Tax Assessment Tax Assessment Total Assessment is a certain percentage of the fair market value that is determined by local assessors to be the total taxable value of land and additions on the property. | Land | Improvement |
|---|---|---|---|---|
| 2025 | $4,815 | $362,000 | $171,300 | $190,700 |
| 2024 | $4,534 | $354,500 | $171,300 | $183,200 |
| 2023 | $3,890 | $306,800 | $142,700 | $164,100 |
| 2022 | $3,586 | $269,800 | $123,100 | $146,700 |
| 2021 | $3,611 | $246,000 | $111,300 | $134,700 |
| 2020 | $3,878 | $254,800 | $111,300 | $143,500 |
| 2019 | $4,389 | $240,500 | $111,300 | $129,200 |
| 2018 | $3,836 | $226,200 | $106,100 | $120,100 |
| 2017 | $3,739 | $214,900 | $100,800 | $114,100 |
| 2016 | $3,763 | $214,900 | $100,800 | $114,100 |
| 2015 | $3,491 | $201,200 | $95,900 | $105,300 |
| 2014 | $4,692 | $194,300 | $95,900 | $98,400 |
Source: Public Records
Map
Nearby Homes