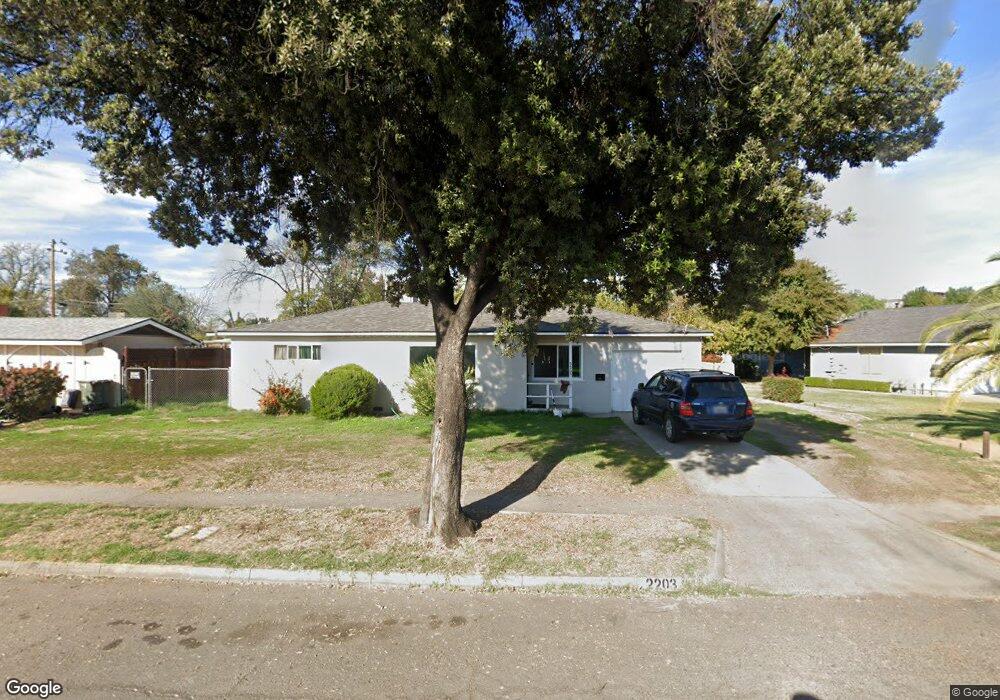
2203 E Berkeley Ave Fresno, CA 93703
McLane NeighborhoodEstimated Value: $269,000 - $277,758
3
Beds
1
Bath
1,034
Sq Ft
$264/Sq Ft
Est. Value
About This Home
This home is located at 2203 E Berkeley Ave, Fresno, CA 93703 and is currently estimated at $273,253, approximately $264 per square foot. 2203 E Berkeley Ave is a home located in Fresno County with nearby schools including Heaton Elementary, Fort Miller Middle School, and Fresno High School.
Ownership History
Date
Name
Owned For
Owner Type
Purchase Details
Closed on
Oct 24, 2019
Sold by
Pinnacle Investments Llc
Bought by
Marathon Rental Properties Llc
Current Estimated Value
Purchase Details
Closed on
Nov 19, 2018
Sold by
Thomas Mose E
Bought by
Takakjian Thomas Denise K
Home Financials for this Owner
Home Financials are based on the most recent Mortgage that was taken out on this home.
Original Mortgage
$100,000
Interest Rate
4.8%
Mortgage Type
Purchase Money Mortgage
Purchase Details
Closed on
Nov 16, 2018
Sold by
Takakjian Thomas Denise K and Takakjian Ralph H
Bought by
Pinnacle Investments Llc
Home Financials for this Owner
Home Financials are based on the most recent Mortgage that was taken out on this home.
Original Mortgage
$100,000
Interest Rate
4.8%
Mortgage Type
Purchase Money Mortgage
Purchase Details
Closed on
Jun 20, 2002
Sold by
Takakjian Ralph H
Bought by
Takakjian Ralph H
Create a Home Valuation Report for This Property
The Home Valuation Report is an in-depth analysis detailing your home's value as well as a comparison with similar homes in the area
Home Values in the Area
Average Home Value in this Area
Purchase History
| Date | Buyer | Sale Price | Title Company |
|---|---|---|---|
| Marathon Rental Properties Llc | -- | None Available | |
| Takakjian Thomas Denise K | -- | Fidelity National Title | |
| Pinnacle Investments Llc | $87,000 | Fidelity National Title | |
| Takakjian Ralph H | -- | -- |
Source: Public Records
Mortgage History
| Date | Status | Borrower | Loan Amount |
|---|---|---|---|
| Previous Owner | Pinnacle Investments Llc | $100,000 |
Source: Public Records
Tax History
| Year | Tax Paid | Tax Assessment Tax Assessment Total Assessment is a certain percentage of the fair market value that is determined by local assessors to be the total taxable value of land and additions on the property. | Land | Improvement |
|---|---|---|---|---|
| 2025 | $1,933 | $147,638 | $43,743 | $103,895 |
| 2023 | $1,824 | $141,907 | $42,046 | $99,861 |
| 2022 | $1,800 | $139,125 | $41,222 | $97,903 |
| 2021 | $1,751 | $136,398 | $40,414 | $95,984 |
| 2020 | $1,743 | $135,000 | $40,000 | $95,000 |
| 2019 | $1,111 | $87,000 | $26,100 | $60,900 |
| 2018 | $991 | $77,583 | $25,855 | $51,728 |
| 2017 | $974 | $76,063 | $25,349 | $50,714 |
| 2016 | $943 | $74,572 | $24,852 | $49,720 |
| 2015 | $929 | $73,453 | $24,479 | $48,974 |
| 2014 | $909 | $72,015 | $24,000 | $48,015 |
Source: Public Records
Map
Nearby Homes
- 2329 E Vassar Ave
- 2021 N Fresno St
- 2234 E University Ave
- 2233 E Terrace Ave
- 2218 N Glenn Ave
- 1735 E Princeton Ave
- 1250 E Vassar Ave
- 1508 N Calaveras St
- 2625 E Michigan Ave
- 2026 E Simpson Ave
- 1211 E Clinton Ave
- 2977 E Harvard Ave
- 2901 E Princeton Ave
- 1441 N Calaveras St
- 2916 E Michigan Ave
- 2136 N First St
- 1136 E Michigan Ave
- 1303 N Calaveras St
- 2702 E Hedges Ave
- 1431 E Shields Ave
- 2204 N Valeria St
- 2218 E Yale Ave
- 2204 E Yale Ave
- 2146 E Berkeley Ave
- 2204 E Berkeley Ave
- 2136 E Berkeley Ave
- 2222 E Berkeley Ave
- 2203 N Valeria St
- 2126 E Berkeley Ave
- 2240 E Berkeley Ave
- 2215 N Valeria St
- 2143 E Cambridge Ave
- 2207 E Cambridge Ave
- 2116 E Berkeley Ave
- 2103 E Berkeley Ave
- 2242 N Valeria St
- 2129 E Cambridge Ave
- 2225 N Valeria St
- 2106 E Berkeley Ave
- 2231 E Cambridge Ave
Your Personal Tour Guide
Ask me questions while you tour the home.