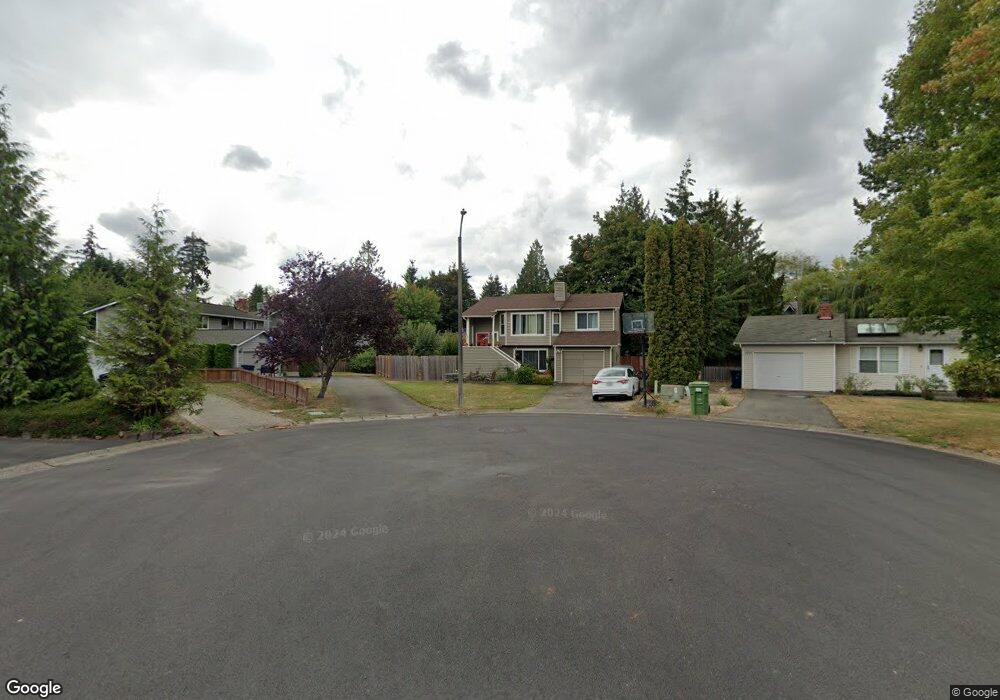
2205 185th St SE Bothell, WA 98012
North Creek NeighborhoodEstimated Value: $754,000 - $828,000
3
Beds
2
Baths
1,956
Sq Ft
$404/Sq Ft
Est. Value
About This Home
This home is located at 2205 185th St SE, Bothell, WA 98012 and is currently estimated at $789,290, approximately $403 per square foot. 2205 185th St SE is a home located in Snohomish County with nearby schools including Crystal Springs Elementary School, Skyview Middle School, and North Creek High School.
Ownership History
Date
Name
Owned For
Owner Type
Purchase Details
Closed on
Oct 11, 2006
Sold by
Crippes Adrian M and Crippes Debra K
Bought by
Cunningham Gene S and Cunningham April Dawn
Current Estimated Value
Home Financials for this Owner
Home Financials are based on the most recent Mortgage that was taken out on this home.
Original Mortgage
$70,500
Outstanding Balance
$4,092
Interest Rate
6.46%
Mortgage Type
Stand Alone Second
Estimated Equity
$785,198
Purchase Details
Closed on
Dec 8, 1999
Sold by
Faubion Guy R
Bought by
Crippes Adrian M and Crippes Debra K
Home Financials for this Owner
Home Financials are based on the most recent Mortgage that was taken out on this home.
Original Mortgage
$175,700
Interest Rate
7.25%
Purchase Details
Closed on
Nov 19, 1996
Sold by
Schaefer John H and Schaefer Stella F
Bought by
Faubion Guy R
Home Financials for this Owner
Home Financials are based on the most recent Mortgage that was taken out on this home.
Original Mortgage
$138,037
Interest Rate
7.88%
Mortgage Type
FHA
Create a Home Valuation Report for This Property
The Home Valuation Report is an in-depth analysis detailing your home's value as well as a comparison with similar homes in the area
Home Values in the Area
Average Home Value in this Area
Purchase History
| Date | Buyer | Sale Price | Title Company |
|---|---|---|---|
| Cunningham Gene S | $352,500 | Multiple | |
| Crippes Adrian M | $184,950 | -- | |
| Faubion Guy R | $140,000 | -- |
Source: Public Records
Mortgage History
| Date | Status | Borrower | Loan Amount |
|---|---|---|---|
| Open | Cunningham Gene S | $70,500 | |
| Open | Cunningham Gene S | $282,000 | |
| Previous Owner | Crippes Adrian M | $175,700 | |
| Previous Owner | Faubion Guy R | $138,037 |
Source: Public Records
Tax History
| Year | Tax Paid | Tax Assessment Tax Assessment Total Assessment is a certain percentage of the fair market value that is determined by local assessors to be the total taxable value of land and additions on the property. | Land | Improvement |
|---|---|---|---|---|
| 2026 | $6,670 | $814,800 | $577,200 | $237,600 |
| 2025 | $6,705 | $739,200 | $504,000 | $235,200 |
| 2024 | $6,705 | $744,300 | $517,000 | $227,300 |
| 2023 | $6,623 | $819,400 | $575,000 | $244,400 |
| 2022 | $6,066 | $596,600 | $387,000 | $209,600 |
| 2020 | $5,428 | $503,300 | $364,000 | $139,300 |
| 2019 | $4,758 | $445,500 | $310,000 | $135,500 |
| 2018 | $4,379 | $381,300 | $260,000 | $121,300 |
| 2017 | $3,867 | $342,200 | $210,000 | $132,200 |
| 2016 | $3,485 | $300,100 | $177,000 | $123,100 |
| 2015 | $3,387 | $276,900 | $165,000 | $111,900 |
| 2013 | $2,979 | $216,100 | $125,000 | $91,100 |
Source: Public Records
Map
Nearby Homes
- 18429 20th Dr SE
- 2401 185th Place SE
- 18809 20th Dr SE
- 18309 26th Dr SE
- 19102 20th Dr SE Unit B204
- 19102 20th Dr SE Unit B202
- 19102 20th Dr SE Unit B206
- 18910 Bothell Everett Hwy Unit H2
- 18910 Bothell Everett Hwy Unit N2
- 18501 28th Ave SE
- 18930 Bothell Everett Hwy Unit B-103
- 18930 Bothell Everett Hwy Unit G103
- 18930 Bothell Everett Hwy Unit G105
- 18632 29th Ave SE
- 18719 12th Dr SE
- 17529 Brook Blvd
- 19218 26th Ave SE Unit 117
- 3028 183rd Place SE
- 1729 194th St SE Unit 19
- 2009 196th St SE Unit E303
- 18433 20th Dr SE
- 2209 185th St SE
- 18503 20th Dr SE
- 2208 185th St SE
- 18427 20th Dr SE
- 2216 185th St SE
- 2213 185th St SE
- 18425 20th Dr SE
- 18505 20th Dr SE
- 2220 185th St SE
- 18513 20th Dr SE
- 18421 36 (Lot 20) Dr SE
- 18432 22nd Dr SE
- 18504 22nd Dr SE
- 18515 20th Dr SE
- 18430 20th Dr SE
- 18426 20th Dr SE
- 18424 20th Dr SE
- 18424 22nd Dr SE
- 2207 185th Place SE
Your Personal Tour Guide
Ask me questions while you tour the home.