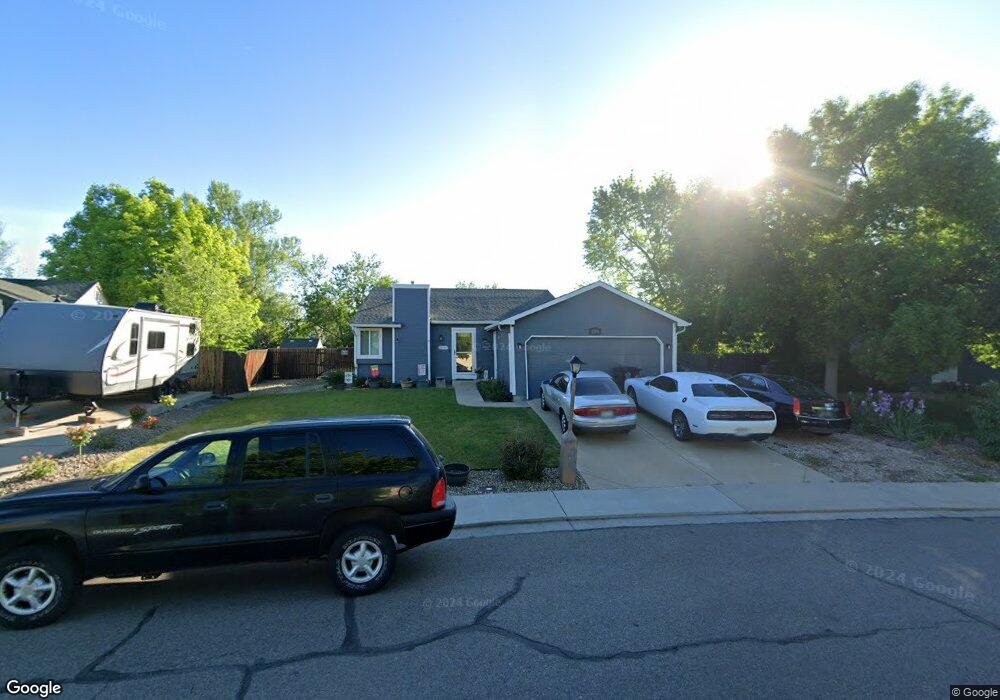
2206 Tulip St Longmont, CO 80501
Garden Acres NeighborhoodEstimated Value: $416,811 - $448,000
3
Beds
2
Baths
896
Sq Ft
$486/Sq Ft
Est. Value
About This Home
This home is located at 2206 Tulip St, Longmont, CO 80501 and is currently estimated at $435,453, approximately $485 per square foot. 2206 Tulip St is a home located in Boulder County with nearby schools including Sanborn Elementary School, Longs Peak Middle School, and Longmont High School.
Ownership History
Date
Name
Owned For
Owner Type
Purchase Details
Closed on
May 7, 2018
Sold by
Calkins Barbara
Bought by
Fresquez Brandan John
Current Estimated Value
Home Financials for this Owner
Home Financials are based on the most recent Mortgage that was taken out on this home.
Original Mortgage
$242,500
Outstanding Balance
$208,993
Interest Rate
4.44%
Mortgage Type
New Conventional
Estimated Equity
$226,460
Purchase Details
Closed on
Sep 26, 2012
Sold by
Calkins Barbara A
Bought by
Calkins Barbara
Home Financials for this Owner
Home Financials are based on the most recent Mortgage that was taken out on this home.
Original Mortgage
$37,648
Interest Rate
3.87%
Mortgage Type
FHA
Purchase Details
Closed on
Jun 21, 1997
Sold by
William Calkins and William Barbara A
Bought by
Calkins Barbara A
Purchase Details
Closed on
Feb 17, 1984
Bought by
Calkins Barbara
Purchase Details
Closed on
Aug 12, 1983
Bought by
Calkins Barbara
Purchase Details
Closed on
Dec 10, 1980
Bought by
Calkins Barbara
Create a Home Valuation Report for This Property
The Home Valuation Report is an in-depth analysis detailing your home's value as well as a comparison with similar homes in the area
Home Values in the Area
Average Home Value in this Area
Purchase History
| Date | Buyer | Sale Price | Title Company |
|---|---|---|---|
| Fresquez Brandan John | $250,000 | First American Title | |
| Calkins Barbara | -- | Land Title Guarantee Company | |
| Calkins Barbara A | -- | -- | |
| Calkins Barbara | $77,000 | -- | |
| Calkins Barbara | $74,600 | -- | |
| Calkins Barbara | -- | -- |
Source: Public Records
Mortgage History
| Date | Status | Borrower | Loan Amount |
|---|---|---|---|
| Open | Fresquez Brandan John | $242,500 | |
| Previous Owner | Calkins Barbara | $37,648 |
Source: Public Records
Tax History Compared to Growth
Tax History
| Year | Tax Paid | Tax Assessment Tax Assessment Total Assessment is a certain percentage of the fair market value that is determined by local assessors to be the total taxable value of land and additions on the property. | Land | Improvement |
|---|---|---|---|---|
| 2025 | $2,633 | $28,657 | $7,688 | $20,969 |
| 2024 | $2,633 | $28,657 | $7,688 | $20,969 |
| 2023 | $2,597 | $27,524 | $8,623 | $22,586 |
| 2022 | $2,346 | $23,706 | $6,345 | $17,361 |
| 2021 | $2,376 | $24,389 | $6,528 | $17,861 |
| 2020 | $2,146 | $22,094 | $5,863 | $16,231 |
| 2019 | $2,112 | $22,094 | $5,863 | $16,231 |
| 2018 | $1,838 | $19,354 | $5,256 | $14,098 |
| 2017 | $1,813 | $21,397 | $5,811 | $15,586 |
| 2016 | $1,654 | $17,305 | $6,925 | $10,380 |
| 2015 | $1,576 | $13,118 | $4,139 | $8,979 |
| 2014 | $1,225 | $13,118 | $4,139 | $8,979 |
Source: Public Records
Map
Nearby Homes
- 2155 Hackberry Cir
- 2160 Sumac St
- 2172 Hackberry Cir
- 2108 Tulip St
- 2412 Sunset Dr
- 2244 Vivian St
- 2124 Kay St
- 2191 Steele St
- 1851 Trevor Cir
- 1855 Trevor Cir
- 2465 Mapleton Cir
- 2104 18th Ave
- 1554 Ervine Ave
- 1736 Trevor Ct
- 2421 Maplewood Cir W
- 2078 Goldfinch Ct
- 2615 Falcon Dr
- 2425 Willow Ln
- 0 Francis St
- 1835 Cambridge Dr