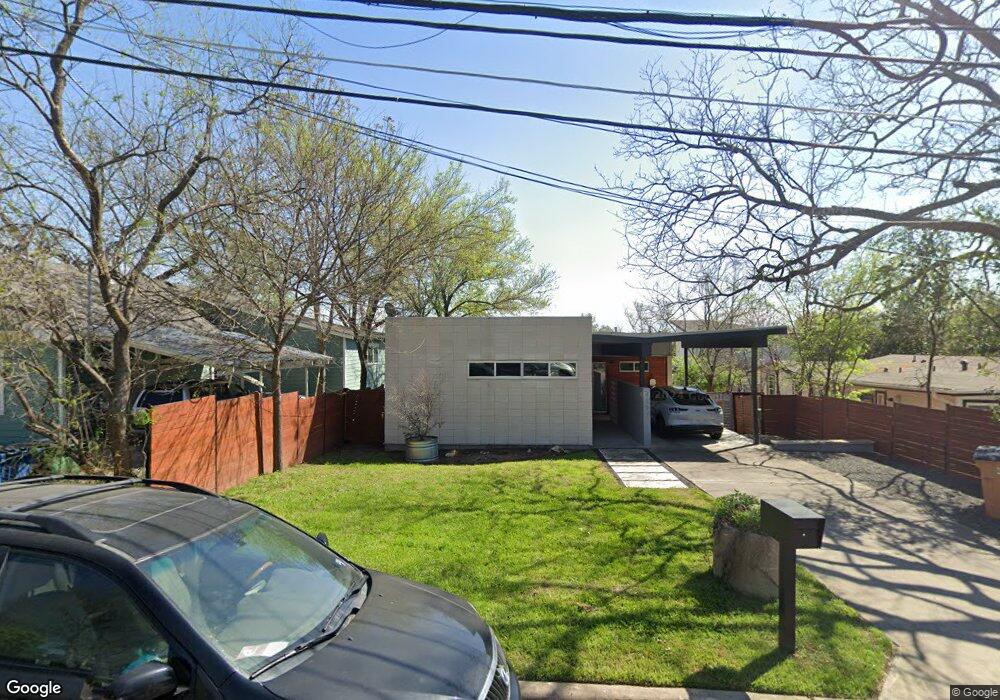
2207 E 18th St Unit B Austin, TX 78702
Chestnut NeighborhoodEstimated Value: $693,000 - $1,487,000
1
Bed
1
Bath
630
Sq Ft
$1,711/Sq Ft
Est. Value
About This Home
This home is located at 2207 E 18th St Unit B, Austin, TX 78702 and is currently estimated at $1,077,644, approximately $1,710 per square foot. 2207 E 18th St Unit B is a home located in Travis County with nearby schools including Campbell Elementary School, Kealing Middle School, and McCallum High School.
Ownership History
Date
Name
Owned For
Owner Type
Purchase Details
Closed on
Nov 16, 2021
Sold by
Whitley Kevin Boyd and Whitley Kevin Boyd
Bought by
Gitlin Gilad and Gitlin Natalya
Current Estimated Value
Home Financials for this Owner
Home Financials are based on the most recent Mortgage that was taken out on this home.
Original Mortgage
$1,180,000
Outstanding Balance
$1,069,837
Interest Rate
2.99%
Mortgage Type
New Conventional
Estimated Equity
$7,807
Purchase Details
Closed on
Jul 18, 2005
Sold by
Whitley Kenneth B and Whitley Charlotte G
Bought by
Whitley Kevin and Gay Faith
Home Financials for this Owner
Home Financials are based on the most recent Mortgage that was taken out on this home.
Original Mortgage
$225,000
Interest Rate
5.58%
Mortgage Type
Construction
Purchase Details
Closed on
Aug 10, 1998
Sold by
Gildon Kirk
Bought by
Gildon George
Purchase Details
Closed on
Aug 30, 1996
Sold by
Gildon George E
Bought by
Gildon Kirk D
Create a Home Valuation Report for This Property
The Home Valuation Report is an in-depth analysis detailing your home's value as well as a comparison with similar homes in the area
Home Values in the Area
Average Home Value in this Area
Purchase History
| Date | Buyer | Sale Price | Title Company |
|---|---|---|---|
| Gitlin Gilad | -- | Texas National Title | |
| Whitley Kevin | -- | -- | |
| Gildon George | -- | Fidelity National Title | |
| Gildon Kirk D | -- | -- |
Source: Public Records
Mortgage History
| Date | Status | Borrower | Loan Amount |
|---|---|---|---|
| Open | Gitlin Gilad | $1,180,000 | |
| Previous Owner | Whitley Kevin | $225,000 |
Source: Public Records
Tax History
| Year | Tax Paid | Tax Assessment Tax Assessment Total Assessment is a certain percentage of the fair market value that is determined by local assessors to be the total taxable value of land and additions on the property. | Land | Improvement |
|---|---|---|---|---|
| 2025 | $17,440 | $1,017,183 | $292,202 | $724,981 |
| 2023 | $19,254 | $1,282,000 | $375,000 | $907,000 |
| 2022 | $27,232 | $1,378,875 | $375,000 | $1,003,875 |
| 2021 | $17,601 | $808,619 | $250,000 | $684,795 |
| 2020 | $15,767 | $735,108 | $250,000 | $485,108 |
| 2018 | $14,110 | $637,326 | $250,000 | $462,841 |
| 2017 | $12,921 | $579,387 | $200,000 | $530,231 |
| 2016 | $11,746 | $526,715 | $180,000 | $545,623 |
| 2015 | $9,664 | $478,832 | $150,000 | $445,188 |
| 2014 | $9,664 | $435,302 | $0 | $0 |
Source: Public Records
Map
Nearby Homes
- 2200 E 18th St
- 1809 Maple Ave Unit 2
- 1709 Maple Ave Unit 2A
- 2105 E 17th St
- 1807 Poquito St Unit 41
- 1807 Poquito St Unit 32
- 1807 Poquito St Unit 39
- 1903 Maple Ave
- 2406 Mlk Blvd
- 2004 E 16th St Unit B
- 2004 Chestnut Ave Unit 1
- 2503 E 18th St
- 1711 Singleton Ave
- 2000 Alamo St
- 1600 Singleton Ave
- 2206 E 14th St Unit 2
- 2305 E 21st St Unit 2
- 1903 E 20th St
- 1800 E Martin Luther King jr Blvd
- 2204 E 13th St Unit A and B
- 2207 E 18th St
- 2205 E 18th St Unit A
- 2205 E 18th St Unit B
- 2205 E 18th St
- 2205 E 18th St Unit 2
- 2205 E 18th St Unit 1
- 2209 E 18th St Unit A
- 2209 E 18th St
- 2211 E 18th St Unit A
- 2211 E 18th St Unit B
- 2203 E 18th St
- 2203 1/2 E 18th St
- 1706 Chestnut Ave
- 1710 Chestnut Ave
- 1710 E 18th St
- 2201 E 18th St Unit B
- 2201 E 18th St Unit A
- 2201 E 18th St
- 2213 E 18th St
- 2208 E 18th St Unit B
Your Personal Tour Guide
Ask me questions while you tour the home.