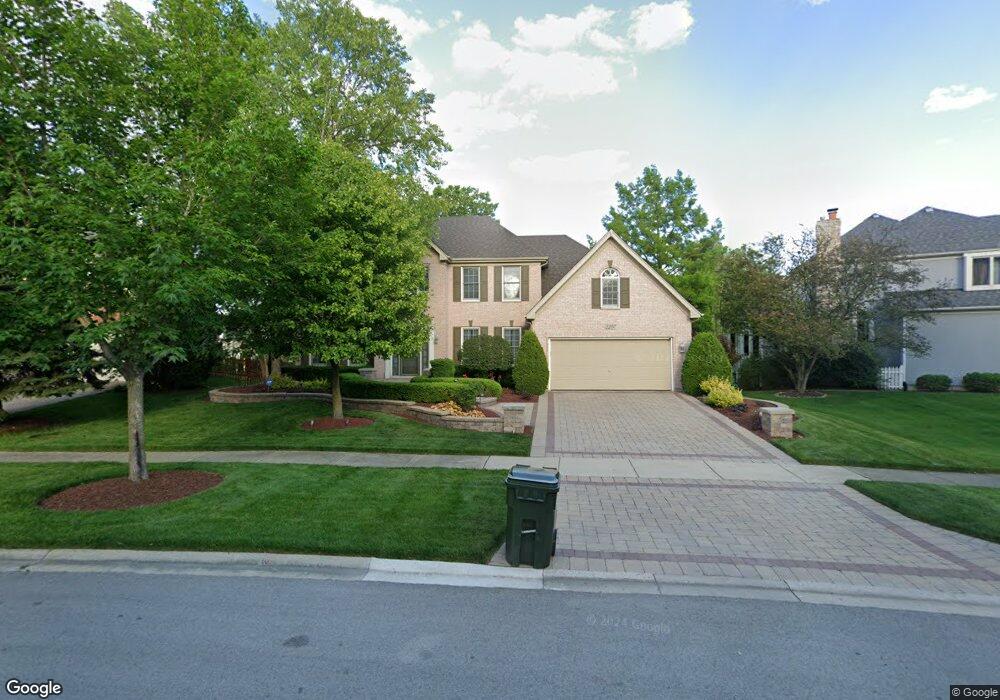
2207 Hillsboro Ln Unit 4 Naperville, IL 60564
Stillwater NeighborhoodEstimated Value: $799,556 - $862,000
--
Bed
1
Bath
2,940
Sq Ft
$284/Sq Ft
Est. Value
About This Home
This home is located at 2207 Hillsboro Ln Unit 4, Naperville, IL 60564 and is currently estimated at $834,139, approximately $283 per square foot. 2207 Hillsboro Ln Unit 4 is a home located in Will County with nearby schools including Welch Elementary School, Ellsworth Elementary School, and Scullen Middle School.
Ownership History
Date
Name
Owned For
Owner Type
Purchase Details
Closed on
Sep 13, 2002
Sold by
Andjelic James S and Andjelic Julie I
Bought by
Furness Michael A and Furness Elizabeth M
Current Estimated Value
Home Financials for this Owner
Home Financials are based on the most recent Mortgage that was taken out on this home.
Original Mortgage
$300,700
Outstanding Balance
$116,511
Interest Rate
5.25%
Mortgage Type
Purchase Money Mortgage
Estimated Equity
$717,628
Purchase Details
Closed on
Sep 17, 1999
Sold by
Oliver Hoffmann Corp
Bought by
Andjelic James S and Andjelic Julie L
Home Financials for this Owner
Home Financials are based on the most recent Mortgage that was taken out on this home.
Original Mortgage
$212,900
Interest Rate
7.72%
Create a Home Valuation Report for This Property
The Home Valuation Report is an in-depth analysis detailing your home's value as well as a comparison with similar homes in the area
Home Values in the Area
Average Home Value in this Area
Purchase History
| Date | Buyer | Sale Price | Title Company |
|---|---|---|---|
| Furness Michael A | $414,500 | Chicago Title Insurance Co | |
| Andjelic James S | $355,000 | Chicago Title Insurance Co |
Source: Public Records
Mortgage History
| Date | Status | Borrower | Loan Amount |
|---|---|---|---|
| Open | Furness Michael A | $300,700 | |
| Previous Owner | Andjelic James S | $212,900 |
Source: Public Records
Tax History Compared to Growth
Tax History
| Year | Tax Paid | Tax Assessment Tax Assessment Total Assessment is a certain percentage of the fair market value that is determined by local assessors to be the total taxable value of land and additions on the property. | Land | Improvement |
|---|---|---|---|---|
| 2024 | $15,043 | $237,673 | $72,166 | $165,507 |
| 2023 | $15,043 | $209,959 | $63,751 | $146,208 |
| 2022 | $13,956 | $198,617 | $60,307 | $138,310 |
| 2021 | $13,341 | $189,159 | $57,435 | $131,724 |
| 2020 | $13,089 | $186,162 | $56,525 | $129,637 |
| 2019 | $12,866 | $180,915 | $54,932 | $125,983 |
| 2018 | $12,928 | $178,579 | $53,724 | $124,855 |
| 2017 | $12,732 | $173,969 | $52,337 | $121,632 |
| 2016 | $12,710 | $170,224 | $51,210 | $119,014 |
| 2015 | $12,662 | $163,677 | $49,240 | $114,437 |
| 2014 | $12,662 | $159,924 | $49,240 | $110,684 |
| 2013 | $12,662 | $159,924 | $49,240 | $110,684 |
Source: Public Records
Map
Nearby Homes
- 2736 Bluewater Cir
- 2543 Dewes Ln
- 2207 Sisters Ave
- 28W555 Leverenz Rd
- 2636 Salix Cir
- 2611 Cedar Glade Dr Unit 204
- 2949 Brossman St
- 2866 Stonewater Dr Unit 102
- 2301 Mecan Dr
- 1329 Neskola Ct
- 1321 Galena Ct
- 2511 Sheehan Dr Unit 203
- 1305 Morningstar Ct Unit 1A
- 2220 Waterleaf Ct Unit 204
- 2227 Waterleaf Ct Unit 203
- 2741 Gateshead Dr
- 1134 Gateshead Dr
- 3311 Fairmont Ave
- 1123 Thackery Ln
- 3349 Rosecroft Ln Unit 2
- 2103 Leverenz Rd
- 2211 Hillsboro Ln Unit 4
- 2451 Sharon Ct
- 2215 Hillsboro Ln
- 2447 Sharon Ct
- 2204 Hillsboro Ln
- 2212 Hillsboro Ln
- 2219 Hillsboro Ln
- 2104 Leverenz Rd
- 2216 Hillsboro Ln
- 2108 Leverenz Rd
- 2439 Sharon Ct
- 2111 Leverenz Rd
- 2452 Sharon Ct
- 2223 Hillsboro Ln
- 2112 Leverenz Rd
- 2220 Hillsboro Ln
- 2448 Sharon Ct
- 2444 Sharon Ct
- 2116 Leverenz Rd