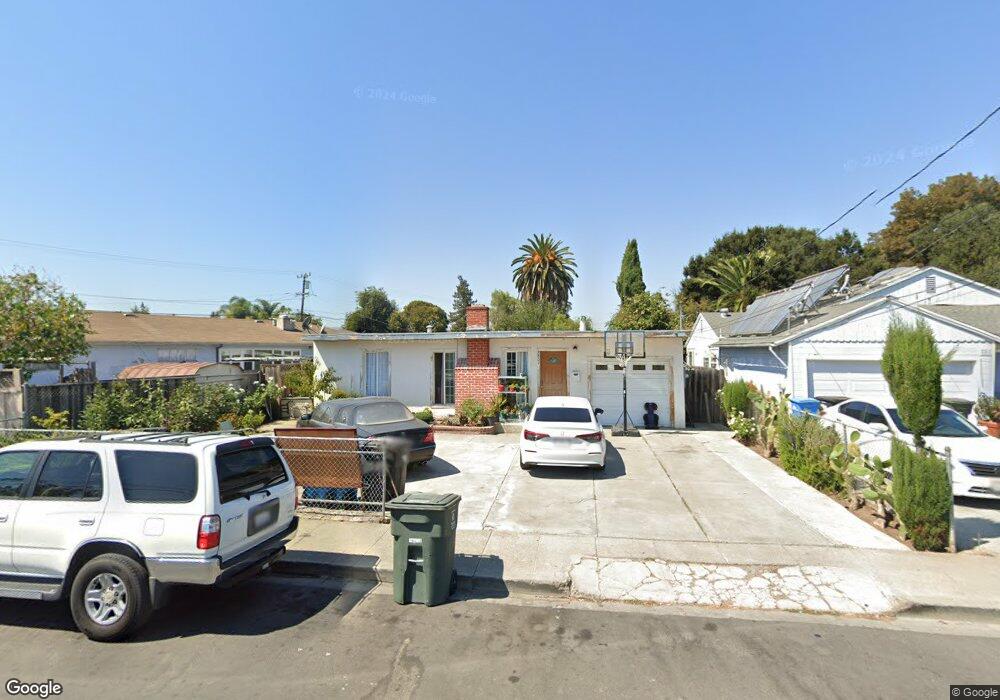
2207 Menalto Ave East Palo Alto, CA 94303
Estimated Value: $894,000 - $950,000
2
Beds
1
Bath
810
Sq Ft
$1,141/Sq Ft
Est. Value
About This Home
This home is located at 2207 Menalto Ave, East Palo Alto, CA 94303 and is currently estimated at $924,490, approximately $1,141 per square foot. 2207 Menalto Ave is a home located in San Mateo County with nearby schools including Menlo-Atherton High School, KIPP Valiant Community Prep, and East Palo Alto Academy.
Ownership History
Date
Name
Owned For
Owner Type
Purchase Details
Closed on
Feb 3, 2023
Sold by
Ibarra Marquez Jesus and Estrada Olivia
Bought by
Marquez Jesus Ibarra and De Ibarra Olivia
Current Estimated Value
Home Financials for this Owner
Home Financials are based on the most recent Mortgage that was taken out on this home.
Original Mortgage
$80,000
Outstanding Balance
$70,620
Interest Rate
5.73%
Mortgage Type
Balloon
Estimated Equity
$853,870
Purchase Details
Closed on
Mar 14, 2022
Sold by
Palo Alto Park Mutual Water Company
Bought by
Palo Alto Park Mutual Water Company
Purchase Details
Closed on
Mar 29, 2002
Sold by
Ibarra Nicolas and Ibarra Esperanza
Bought by
Ibarra Jesus and Ibarra Olivia
Create a Home Valuation Report for This Property
The Home Valuation Report is an in-depth analysis detailing your home's value as well as a comparison with similar homes in the area
Home Values in the Area
Average Home Value in this Area
Purchase History
| Date | Buyer | Sale Price | Title Company |
|---|---|---|---|
| Marquez Jesus Ibarra | -- | Chicago Title Company | |
| Palo Alto Park Mutual Water Company | -- | None Listed On Document | |
| Ibarra Jesus | -- | -- |
Source: Public Records
Mortgage History
| Date | Status | Borrower | Loan Amount |
|---|---|---|---|
| Open | Marquez Jesus Ibarra | $80,000 |
Source: Public Records
Tax History Compared to Growth
Tax History
| Year | Tax Paid | Tax Assessment Tax Assessment Total Assessment is a certain percentage of the fair market value that is determined by local assessors to be the total taxable value of land and additions on the property. | Land | Improvement |
|---|---|---|---|---|
| 2025 | $5,456 | $276,838 | $138,419 | $138,419 |
| 2023 | $5,456 | $266,090 | $133,045 | $133,045 |
| 2022 | $5,048 | $260,874 | $130,437 | $130,437 |
| 2021 | $4,930 | $255,760 | $127,880 | $127,880 |
| 2020 | $4,822 | $253,138 | $126,569 | $126,569 |
| 2019 | $4,782 | $248,176 | $124,088 | $124,088 |
| 2018 | $4,662 | $243,310 | $121,655 | $121,655 |
| 2017 | $4,471 | $238,540 | $119,270 | $119,270 |
| 2016 | $4,436 | $233,864 | $116,932 | $116,932 |
| 2015 | $4,334 | $230,352 | $115,176 | $115,176 |
| 2014 | $4,201 | $225,840 | $112,920 | $112,920 |
Source: Public Records
Map
Nearby Homes
- 1024 Laurel Ave
- 315 Haight St
- 2118 Addison Ave
- 1133 Jervis Ave
- 903 Laurel Ave
- 2273 Dumbarton Ave
- 1257 Laurel Ave
- 2375 Palo Verde Ave
- 165 E Okeefe St Unit 10
- 2112 Lincoln St
- 1221 Westminster Ave
- 1120 Alberni St
- 1002 Alberni St
- 813 Bay Rd
- 811 Bay Rd
- 637 Central Ave
- 505 Runnymede St Unit C
- 2232 Euclid Ave
- 1127 Madera Ave
- 2396 Glen Way
- 2211 Menalto Ave
- 100 Holland St
- 112 Holland St
- 2215 Menalto Ave
- 2219 Menalto Ave
- 1002 Bradley Way
- 2210 Menalto Ave
- 1004 Bradley Way
- 2216 Menalto Ave
- 115 Holland St
- 111 Holland St
- 2224 Menalto Ave
- 119 Holland St
- 2223 Menalto Ave
- 1008 Bradley Way
- 123 Holland St
- 100 Garden St
- 2230 Menalto Ave
- 1012 Bradley Way
- 2203 Menalto Ave