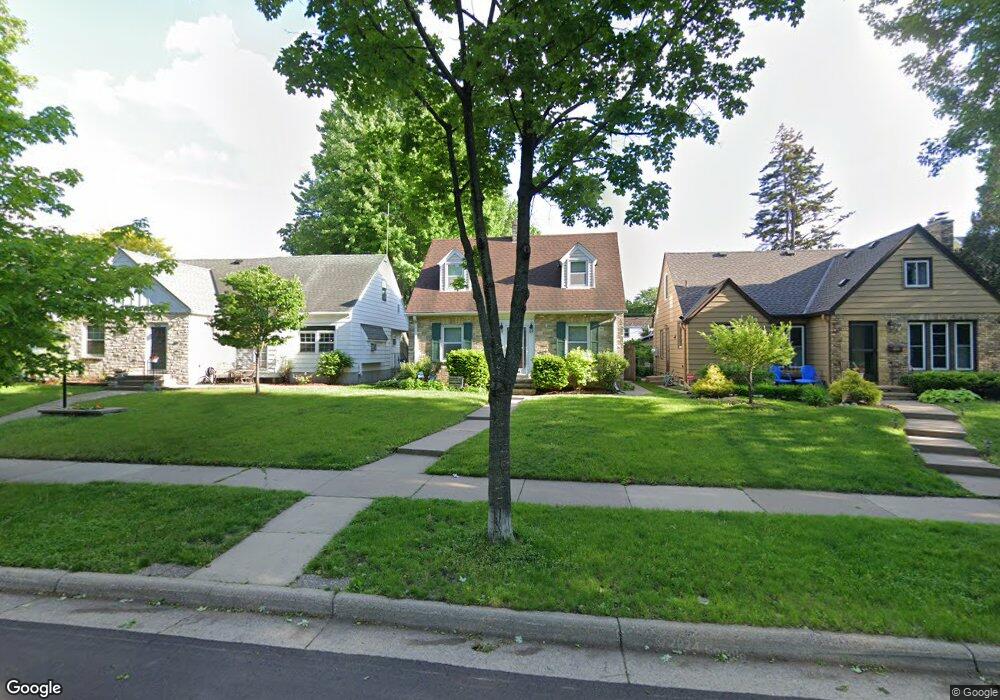
2208 Bayard Ave Saint Paul, MN 55116
Highland Park NeighborhoodEstimated Value: $570,750 - $635,000
4
Beds
3
Baths
2,150
Sq Ft
$282/Sq Ft
Est. Value
About This Home
This home is located at 2208 Bayard Ave, Saint Paul, MN 55116 and is currently estimated at $606,188, approximately $281 per square foot. 2208 Bayard Ave is a home located in Ramsey County with nearby schools including Horace Mann School, Highland Park Middle School, and Highland Park Senior High.
Ownership History
Date
Name
Owned For
Owner Type
Purchase Details
Closed on
Dec 18, 2015
Sold by
Heichert Richard E and Heichert Susan A
Bought by
Robertson Katherine and Robertson Kyle P
Current Estimated Value
Home Financials for this Owner
Home Financials are based on the most recent Mortgage that was taken out on this home.
Original Mortgage
$375,200
Outstanding Balance
$297,607
Interest Rate
3.96%
Mortgage Type
New Conventional
Estimated Equity
$308,581
Purchase Details
Closed on
Dec 6, 2012
Sold by
Heichert Susan A and Heichert Richard E
Bought by
Heichert Susan A and Heichert Richard E
Home Financials for this Owner
Home Financials are based on the most recent Mortgage that was taken out on this home.
Original Mortgage
$308,000
Interest Rate
3.36%
Mortgage Type
New Conventional
Purchase Details
Closed on
Jan 26, 2001
Sold by
Karr Karen I
Bought by
Czechowski Jan C and Czechowski Leslie J
Purchase Details
Closed on
Jun 30, 1999
Sold by
Bernier Robert E and Bernier Florine L
Bought by
Skor Ed L and Karr Karen I
Create a Home Valuation Report for This Property
The Home Valuation Report is an in-depth analysis detailing your home's value as well as a comparison with similar homes in the area
Home Values in the Area
Average Home Value in this Area
Purchase History
| Date | Buyer | Sale Price | Title Company |
|---|---|---|---|
| Robertson Katherine | $395,000 | Burnet Title | |
| Heichert Susan A | $515 | First American Title | |
| Czechowski Jan C | $259,900 | -- | |
| Skor Ed L | $225,000 | -- |
Source: Public Records
Mortgage History
| Date | Status | Borrower | Loan Amount |
|---|---|---|---|
| Open | Robertson Katherine | $375,200 | |
| Previous Owner | Heichert Susan A | $308,000 |
Source: Public Records
Tax History Compared to Growth
Tax History
| Year | Tax Paid | Tax Assessment Tax Assessment Total Assessment is a certain percentage of the fair market value that is determined by local assessors to be the total taxable value of land and additions on the property. | Land | Improvement |
|---|---|---|---|---|
| 2025 | $8,496 | $546,400 | $182,100 | $364,300 |
| 2023 | $8,496 | $537,100 | $182,100 | $355,000 |
| 2022 | $7,160 | $497,000 | $182,100 | $314,900 |
| 2021 | $6,872 | $442,700 | $182,100 | $260,600 |
| 2020 | $7,416 | $440,700 | $182,100 | $258,600 |
| 2019 | $7,082 | $441,800 | $182,100 | $259,700 |
| 2018 | $6,774 | $416,400 | $182,100 | $234,300 |
| 2017 | $6,320 | $410,100 | $182,100 | $228,000 |
| 2016 | $6,350 | $0 | $0 | $0 |
| 2015 | $6,240 | $369,300 | $156,100 | $213,200 |
| 2014 | $6,460 | $0 | $0 | $0 |
Source: Public Records
Map
Nearby Homes
- 700 Mississippi River Blvd S
- 475 Mount Curve Blvd
- 677 Wilder St S
- 956 Mississippi River Blvd S
- 2114 Randolph Ave
- 842 S Woodlawn Ave
- 840 S Woodlawn Ave
- 875 Falls Passage W Unit C
- 909 Mount Curve Blvd Unit F
- 909 Mount Curve Blvd Unit I
- 909 Mount Curve Blvd Unit G
- 909 Mount Curve Blvd Unit H
- 909 Mount Curve Blvd Unit E
- 909 Mount Curve Blvd Unit D
- 870 Mount Curve Blvd Unit F
- 870 Mount Curve Blvd Unit L
- 906 S Woodlawn Ave Unit H
- 906 S Woodlawn Ave Unit A
- 906 S Woodlawn Ave Unit E
- 1941 Ford Pkwy Unit 102
- 2208 2208 Bayard Ave
- 2212 Bayard Ave
- 2204 Bayard Ave
- 2216 Bayard Ave
- 2200 Bayard Ave
- 2194 Bayard Ave
- 2194 2194 Bayard Ave
- 2211 Scheffer Ave
- 2220 Bayard Ave
- 2207 Scheffer Ave
- 2215 Scheffer Ave
- 2203 Scheffer Ave
- 2221 Scheffer Ave
- 2190 Bayard Ave
- 2190 2190 Bayard Ave
- 2209 Bayard Ave
- 2197 Scheffer Ave
- 2215 Bayard Ave
- 2215 2215 Bayard Ave
- 2203 Bayard Ave