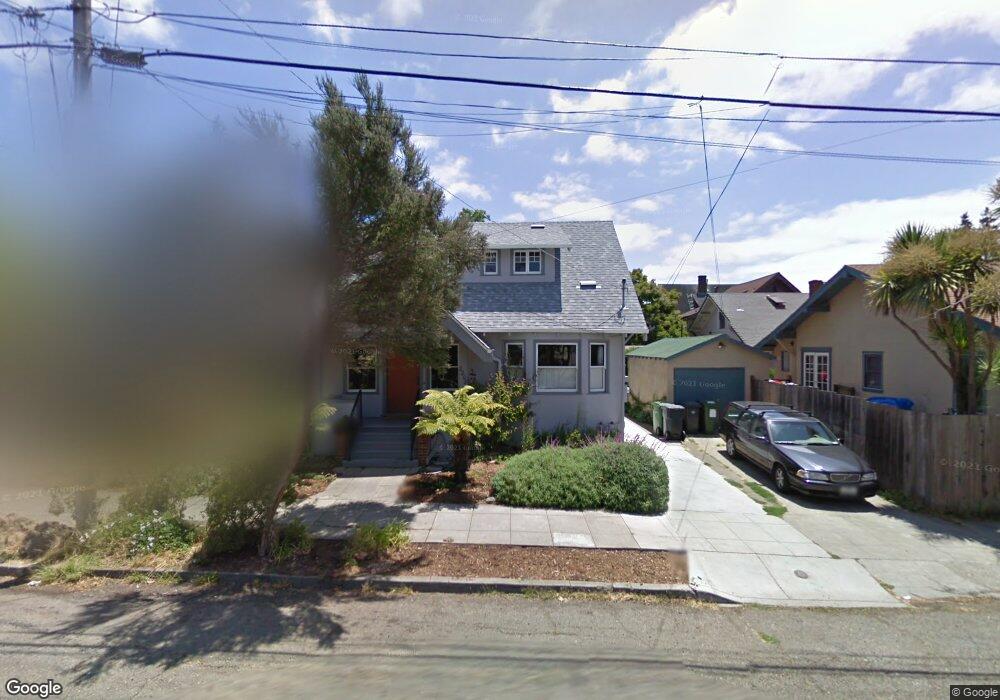
2208 Derby St Berkeley, CA 94705
South Berkeley NeighborhoodEstimated Value: $505,000 - $1,012,000
1
Bed
1
Bath
580
Sq Ft
$1,170/Sq Ft
Est. Value
About This Home
This home is located at 2208 Derby St, Berkeley, CA 94705 and is currently estimated at $678,333, approximately $1,169 per square foot. 2208 Derby St is a home located in Alameda County with nearby schools including Emerson Elementary School, Malcolm X Elementary School, and John Muir Elementary School.
Ownership History
Date
Name
Owned For
Owner Type
Purchase Details
Closed on
May 11, 2016
Sold by
Crumley Elizabeth R
Bought by
Crumley Elizabeth R
Current Estimated Value
Home Financials for this Owner
Home Financials are based on the most recent Mortgage that was taken out on this home.
Original Mortgage
$757,500
Interest Rate
4.09%
Mortgage Type
Reverse Mortgage Home Equity Conversion Mortgage
Purchase Details
Closed on
Jun 19, 2008
Sold by
Crumley Elizabeth R
Bought by
Crumley Elizabeth R
Create a Home Valuation Report for This Property
The Home Valuation Report is an in-depth analysis detailing your home's value as well as a comparison with similar homes in the area
Home Values in the Area
Average Home Value in this Area
Purchase History
| Date | Buyer | Sale Price | Title Company |
|---|---|---|---|
| Crumley Elizabeth R | -- | First American Title Company | |
| Crumley Elizabeth R | -- | Accommodation |
Source: Public Records
Mortgage History
| Date | Status | Borrower | Loan Amount |
|---|---|---|---|
| Closed | Crumley Elizabeth R | $757,500 |
Source: Public Records
Tax History
| Year | Tax Paid | Tax Assessment Tax Assessment Total Assessment is a certain percentage of the fair market value that is determined by local assessors to be the total taxable value of land and additions on the property. | Land | Improvement |
|---|---|---|---|---|
| 2025 | $2,367 | $47,218 | $18,752 | $35,466 |
| 2024 | $2,367 | $46,156 | $18,385 | $34,771 |
| 2023 | $2,297 | $52,113 | $18,024 | $34,089 |
| 2022 | $2,216 | $44,092 | $17,671 | $33,421 |
| 2021 | $2,192 | $43,091 | $17,325 | $32,766 |
| 2020 | $1,998 | $49,577 | $17,147 | $32,430 |
| 2019 | $1,830 | $48,605 | $16,811 | $31,794 |
| 2018 | $1,776 | $47,652 | $16,481 | $31,171 |
| 2017 | $1,683 | $46,718 | $16,158 | $30,560 |
| 2016 | $1,561 | $45,802 | $15,841 | $29,961 |
| 2015 | $1,529 | $45,115 | $15,604 | $29,511 |
| 2014 | $1,494 | $44,231 | $15,298 | $28,933 |
Source: Public Records
Map
Nearby Homes
- 2319 Ward St
- 2123 Oregon St
- 2702 Dana St
- 2550 Dana St Unit 2F
- 2018 Blake St
- 2923 Wheeler St
- 2535 Chilton Way
- 2243 Ashby Ave
- 2917 Telegraph Ave
- 2110 Ashby Ave
- 1901 Parker St Unit 3
- 2935 Florence St
- 2057 Emerson St
- 2509 Dwight Way
- 3046 Deakin St
- 2701 Grant St
- 2643 Stuart St
- 2601 College Ave Unit 203
- 2601 College Ave Unit 208
- 629 66th St
Your Personal Tour Guide
Ask me questions while you tour the home.