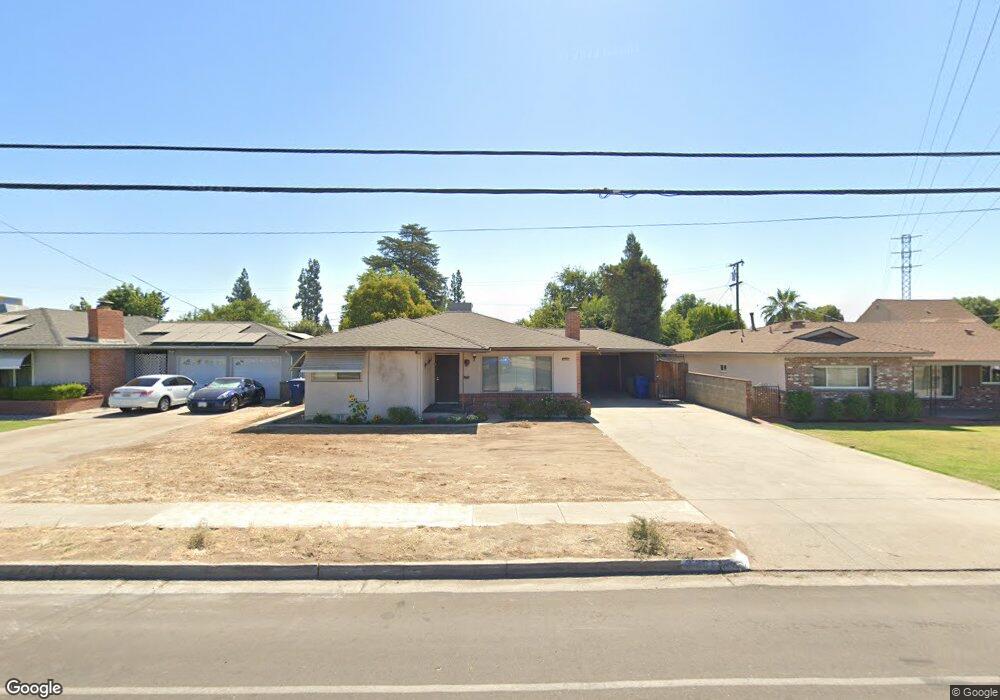
2208 N Maple Ave Fresno, CA 93703
McLane NeighborhoodEstimated Value: $315,000 - $335,587
2
Beds
2
Baths
1,300
Sq Ft
$253/Sq Ft
Est. Value
About This Home
This home is located at 2208 N Maple Ave, Fresno, CA 93703 and is currently estimated at $328,647, approximately $252 per square foot. 2208 N Maple Ave is a home located in Fresno County with nearby schools including Norseman Elementary School, Scandinavian Middle School, and Mclane High School.
Ownership History
Date
Name
Owned For
Owner Type
Purchase Details
Closed on
May 2, 2023
Sold by
Preston Patricia K
Bought by
Yang Cassie Chue
Current Estimated Value
Home Financials for this Owner
Home Financials are based on the most recent Mortgage that was taken out on this home.
Original Mortgage
$200,000
Outstanding Balance
$194,469
Interest Rate
6.42%
Mortgage Type
New Conventional
Estimated Equity
$134,178
Purchase Details
Closed on
Dec 11, 2018
Sold by
Preston Patricia K
Bought by
Preston Patricia K and Yang Cassie Chue
Purchase Details
Closed on
May 29, 1996
Sold by
Preston Robert A
Bought by
Preston Robert A and Preston Patricia K
Home Financials for this Owner
Home Financials are based on the most recent Mortgage that was taken out on this home.
Original Mortgage
$45,245
Interest Rate
7.51%
Create a Home Valuation Report for This Property
The Home Valuation Report is an in-depth analysis detailing your home's value as well as a comparison with similar homes in the area
Home Values in the Area
Average Home Value in this Area
Purchase History
| Date | Buyer | Sale Price | Title Company |
|---|---|---|---|
| Yang Cassie Chue | -- | Chicago Title | |
| Preston Patricia K | -- | None Available | |
| Preston Robert A | -- | First American Title Ins Co |
Source: Public Records
Mortgage History
| Date | Status | Borrower | Loan Amount |
|---|---|---|---|
| Open | Yang Cassie Chue | $200,000 | |
| Previous Owner | Preston Robert A | $45,245 |
Source: Public Records
Tax History Compared to Growth
Tax History
| Year | Tax Paid | Tax Assessment Tax Assessment Total Assessment is a certain percentage of the fair market value that is determined by local assessors to be the total taxable value of land and additions on the property. | Land | Improvement |
|---|---|---|---|---|
| 2025 | $3,872 | $317,322 | $62,424 | $254,898 |
| 2023 | $893 | $68,890 | $10,623 | $58,267 |
| 2022 | $881 | $67,540 | $10,415 | $57,125 |
| 2021 | $858 | $66,216 | $10,211 | $56,005 |
| 2020 | $854 | $65,538 | $10,107 | $55,431 |
| 2019 | $822 | $64,254 | $9,909 | $54,345 |
| 2018 | $804 | $62,995 | $9,715 | $53,280 |
| 2017 | $791 | $61,761 | $9,525 | $52,236 |
| 2016 | $765 | $60,551 | $9,339 | $51,212 |
| 2015 | $754 | $59,642 | $9,199 | $50,443 |
| 2014 | $740 | $58,474 | $9,019 | $49,455 |
Source: Public Records
Map
Nearby Homes
- 2238 N Maple Ave
- 4597 E Cambridge Ave
- 4641 E Weldon Ave
- 4625 E Princeton Ave
- 4674 E Princeton Ave
- 4747 E Clinton Ave
- 2441 N Chestnut Ave
- 4704 E Simpson Ave
- 4787 E Cornell Ave
- 4454 E Simpson Ave
- 4318 E Fairfax Ave
- 4463 E Home Ave
- 4453 E Home Ave
- 4791 E Simpson Ave
- 4819 E Home Ave
- 1745 N Winery Ave Unit 140
- 1745 N Winery Ave Unit 102
- 4875 E Mckinley Ave Unit 129
- 4808 E Pine Ave
- 4843 E Oslin Ave
- 2218 N Maple Ave
- 2146 N Maple Ave
- 2207 N Price Ave
- 2228 N Maple Ave
- 2136 N Maple Ave
- 2217 N Price Ave
- 2147 N Price Ave
- 2227 N Price Ave
- 2135 N Price Ave
- 2125 N Price Ave
- 2126 N Maple Ave
- 2147 N Maple Ave
- 2231 N Maple Ave
- 2237 N Price Ave
- 2248 N Maple Ave
- 2114 N Maple Ave
- 2247 N Price Ave
- 2242 N Meridian Ave
- 2216 N Price Ave
- 2206 N Meridian Ave