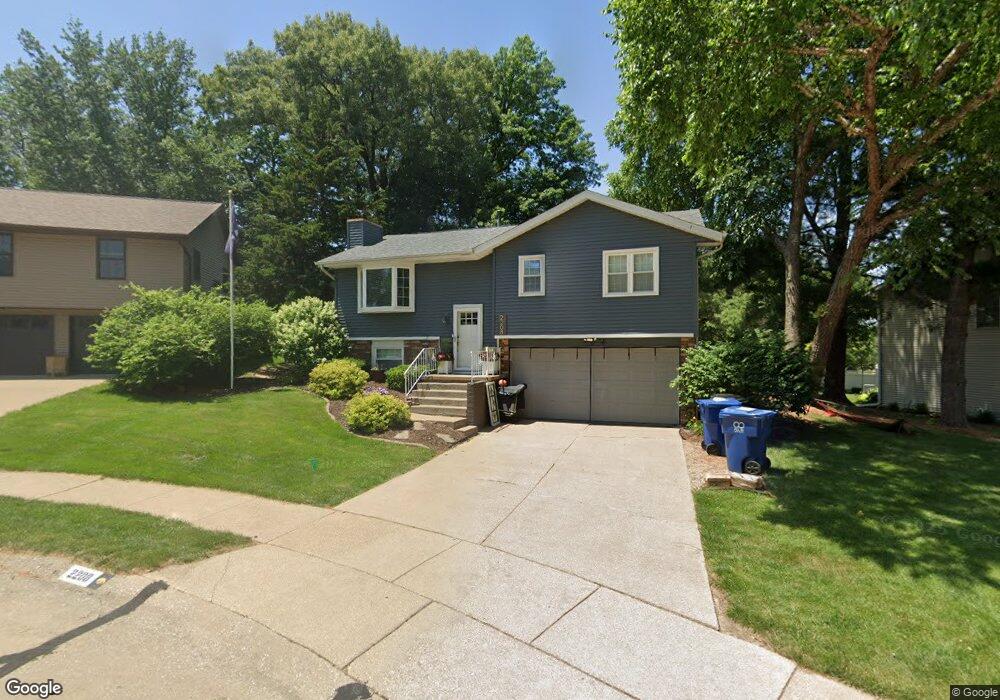
2208 Spring Ct Davenport, IA 52803
East End NeighborhoodEstimated Value: $196,000 - $246,000
3
Beds
2
Baths
948
Sq Ft
$241/Sq Ft
Est. Value
About This Home
This home is located at 2208 Spring Ct, Davenport, IA 52803 and is currently estimated at $228,192, approximately $240 per square foot. 2208 Spring Ct is a home located in Scott County with nearby schools including Caverna Elementary School, Casey County Middle School, and Hopkinsville Middle School.
Ownership History
Date
Name
Owned For
Owner Type
Purchase Details
Closed on
Oct 27, 2025
Sold by
Eberlin Russell J and Hadjis Peter H
Bought by
Eberlin Laura M
Current Estimated Value
Purchase Details
Closed on
Jun 9, 2017
Sold by
Camilo Pineda
Bought by
Hadjis Allison and Hadjis Peter
Home Financials for this Owner
Home Financials are based on the most recent Mortgage that was taken out on this home.
Original Mortgage
$165,447
Interest Rate
3.89%
Purchase Details
Closed on
Sep 10, 2013
Sold by
Marranca Anthony P and Marranca Nicholas R
Bought by
Pineda Camilo and Tanabe Akiko
Home Financials for this Owner
Home Financials are based on the most recent Mortgage that was taken out on this home.
Original Mortgage
$161,294
Interest Rate
4.38%
Mortgage Type
VA
Purchase Details
Closed on
May 26, 2006
Sold by
Spicer Josh L and Spicer Mica E
Bought by
Marranca Anthony P and Gentry Nichole R
Home Financials for this Owner
Home Financials are based on the most recent Mortgage that was taken out on this home.
Original Mortgage
$120,000
Interest Rate
6.66%
Mortgage Type
Purchase Money Mortgage
Create a Home Valuation Report for This Property
The Home Valuation Report is an in-depth analysis detailing your home's value as well as a comparison with similar homes in the area
Home Values in the Area
Average Home Value in this Area
Purchase History
| Date | Buyer | Sale Price | Title Company |
|---|---|---|---|
| Eberlin Laura M | -- | None Listed On Document | |
| Hadjis Allison | -- | -- | |
| Pineda Camilo | $158,000 | None Available | |
| Marranca Anthony P | $120,000 | None Available |
Source: Public Records
Mortgage History
| Date | Status | Borrower | Loan Amount |
|---|---|---|---|
| Previous Owner | Hadjis Allison | $165,447 | |
| Previous Owner | Hadjis Allison | -- | |
| Previous Owner | Pineda Camilo | $161,294 | |
| Previous Owner | Marranca Anthony P | $120,000 |
Source: Public Records
Tax History Compared to Growth
Tax History
| Year | Tax Paid | Tax Assessment Tax Assessment Total Assessment is a certain percentage of the fair market value that is determined by local assessors to be the total taxable value of land and additions on the property. | Land | Improvement |
|---|---|---|---|---|
| 2025 | $3,528 | $217,310 | $41,280 | $176,030 |
| 2024 | $3,444 | $197,450 | $41,280 | $156,170 |
| 2023 | $3,704 | $197,450 | $41,280 | $156,170 |
| 2022 | $3,720 | $173,370 | $37,150 | $136,220 |
| 2021 | $3,720 | $173,370 | $37,150 | $136,220 |
| 2020 | $3,520 | $162,020 | $37,150 | $124,870 |
| 2019 | $3,558 | $158,620 | $37,150 | $121,470 |
| 2018 | $3,350 | $158,620 | $37,150 | $121,470 |
| 2017 | $848 | $152,520 | $37,150 | $115,370 |
| 2016 | $3,164 | $156,500 | $0 | $0 |
| 2015 | $3,164 | $152,420 | $0 | $0 |
| 2014 | $3,118 | $127,530 | $0 | $0 |
| 2013 | $2,588 | $0 | $0 | $0 |
| 2012 | -- | $118,000 | $34,100 | $83,900 |
Source: Public Records
Map
Nearby Homes
- 2103 E Lombard St
- 2125 Eastern Ave
- 2316 E Pleasant St
- 1815 Belle Ave
- 1803 Belle Ave
- 2429 E Central Park Ave
- 1626 Esplanade Ave
- 2706 Ridgewood Ave
- 9 Parkwood Dr
- 1504 Christie St
- 1616 Esplanade Ave
- 2316 East St
- 1704 Jersey Ridge Rd
- 2618 Elm St
- 1734 Ridgewood Ave
- 2440 Carey Ave
- 2734 Bridge Ave
- 1021 E Central Park Ave
- 1310 Kirkwood Blvd
- 1515 Jersey Ridge Rd
- 2218 Spring Ct
- 2218 Spring Ct
- 2204 Spring Ct
- 1823 E Rusholme St
- 2202 Spring Ct
- 1919 E Rusholme St
- 1815 E Rusholme St
- 2201 Spring Ct
- 2203 Spring Ct
- 1826 E Rusholme St
- 1912 E Rusholme St
- 2003 E Rusholme St
- 1918 E Rusholme St
- 1814 E Rusholme St
- 1811 E Rusholme St
- 1922 Elm St
- 2011 E Rusholme St
- 2319 Highland Park Ct
- 1918 Elm St
- 2004 E Rusholme St