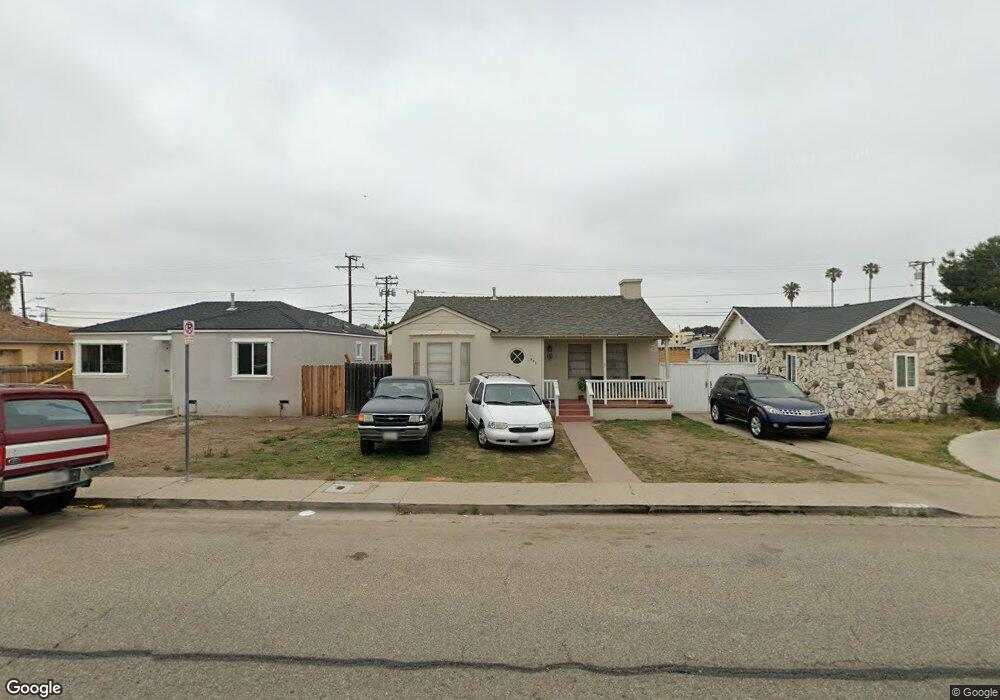
221 E Ash St Oxnard, CA 93033
Cal-Gisler NeighborhoodEstimated Value: $610,952 - $655,000
2
Beds
1
Bath
974
Sq Ft
$649/Sq Ft
Est. Value
About This Home
This home is located at 221 E Ash St, Oxnard, CA 93033 and is currently estimated at $631,988, approximately $648 per square foot. 221 E Ash St is a home located in Ventura County with nearby schools including Elm Street Elementary School, R.J. Frank Academy of Marine Science & Engineering, and Santa Clara High School.
Ownership History
Date
Name
Owned For
Owner Type
Purchase Details
Closed on
Dec 4, 2018
Sold by
Villafana Andres Granados and Granados Andres
Bought by
Villafana Andres Granados
Current Estimated Value
Home Financials for this Owner
Home Financials are based on the most recent Mortgage that was taken out on this home.
Original Mortgage
$293,000
Outstanding Balance
$258,139
Interest Rate
4.8%
Mortgage Type
New Conventional
Estimated Equity
$373,849
Purchase Details
Closed on
Mar 22, 2013
Sold by
Granados Andres and Delgado William
Bought by
Granados Andres
Home Financials for this Owner
Home Financials are based on the most recent Mortgage that was taken out on this home.
Original Mortgage
$213,115
Interest Rate
3.37%
Mortgage Type
FHA
Purchase Details
Closed on
Apr 21, 2010
Sold by
Delgado Maria C
Bought by
Delgado William
Home Financials for this Owner
Home Financials are based on the most recent Mortgage that was taken out on this home.
Original Mortgage
$211,105
Interest Rate
5.37%
Mortgage Type
FHA
Purchase Details
Closed on
Mar 12, 2010
Sold by
Berntsen Paul and Berntsen Mark
Bought by
Granados Andres and Delgado William
Home Financials for this Owner
Home Financials are based on the most recent Mortgage that was taken out on this home.
Original Mortgage
$211,105
Interest Rate
5.37%
Mortgage Type
FHA
Purchase Details
Closed on
Apr 11, 2008
Sold by
Gutierrez Teodoro S and Gutierrez Della J
Bought by
Lasalle Bank Na
Purchase Details
Closed on
Apr 15, 2003
Sold by
Berntsen Lorraine M
Bought by
Berntsen Lorraine M
Purchase Details
Closed on
Oct 8, 2002
Sold by
Berntsen Paul D
Bought by
Berntsen Lorraine
Home Financials for this Owner
Home Financials are based on the most recent Mortgage that was taken out on this home.
Original Mortgage
$92,000
Interest Rate
6.05%
Create a Home Valuation Report for This Property
The Home Valuation Report is an in-depth analysis detailing your home's value as well as a comparison with similar homes in the area
Home Values in the Area
Average Home Value in this Area
Purchase History
| Date | Buyer | Sale Price | Title Company |
|---|---|---|---|
| Villafana Andres Granados | -- | None Available | |
| Granados Andres | $107,000 | Fidelity National Title Co | |
| Delgado William | -- | Chicago Title Company | |
| Granados Andres | -- | Chicago Title Company | |
| Granados Andres | $215,000 | Chicago Title Company | |
| Lasalle Bank Na | $226,408 | None Available | |
| Berntsen Lorraine M | -- | -- | |
| Berntsen Lorraine | $46,000 | Ticor Title |
Source: Public Records
Mortgage History
| Date | Status | Borrower | Loan Amount |
|---|---|---|---|
| Open | Villafana Andres Granados | $293,000 | |
| Closed | Granados Andres | $213,115 | |
| Previous Owner | Granados Andres | $211,105 | |
| Previous Owner | Berntsen Lorraine | $92,000 |
Source: Public Records
Tax History
| Year | Tax Paid | Tax Assessment Tax Assessment Total Assessment is a certain percentage of the fair market value that is determined by local assessors to be the total taxable value of land and additions on the property. | Land | Improvement |
|---|---|---|---|---|
| 2025 | $3,311 | $277,509 | $105,840 | $171,669 |
| 2024 | $3,311 | $272,068 | $103,765 | $168,303 |
| 2023 | $3,189 | $266,734 | $101,731 | $165,003 |
| 2022 | $3,092 | $261,504 | $99,736 | $161,768 |
| 2021 | $3,066 | $256,377 | $97,780 | $158,597 |
| 2020 | $3,122 | $253,750 | $96,778 | $156,972 |
| 2019 | $3,033 | $248,776 | $94,881 | $153,895 |
| 2018 | $2,989 | $243,899 | $93,021 | $150,878 |
| 2017 | $2,836 | $239,118 | $91,198 | $147,920 |
| 2016 | $2,736 | $234,430 | $89,410 | $145,020 |
| 2015 | $2,764 | $230,911 | $88,068 | $142,843 |
| 2014 | $2,732 | $226,390 | $86,344 | $140,046 |
Source: Public Records
Map
Nearby Homes
- 1239 S C St
- 225 W Iris St
- 1127 S C St
- 865 S B St Unit Q1
- 819 S B St Unit 34
- 633 Meta St
- 2024 S J St
- 1030 Ilena St
- 2151 E Wooley Rd
- 550 S G St
- 603 S G St
- 3151 Fournier St
- 3130 Paula St
- 807 Kingfisher Way
- 1174 Oyster Place Unit 15
- 403 E 2nd St
- 136 S Roosevelt Ave
- 1501 Pisco Ln
- 1231 Lost Point Ln
- 1309 Nautical Way
Your Personal Tour Guide
Ask me questions while you tour the home.