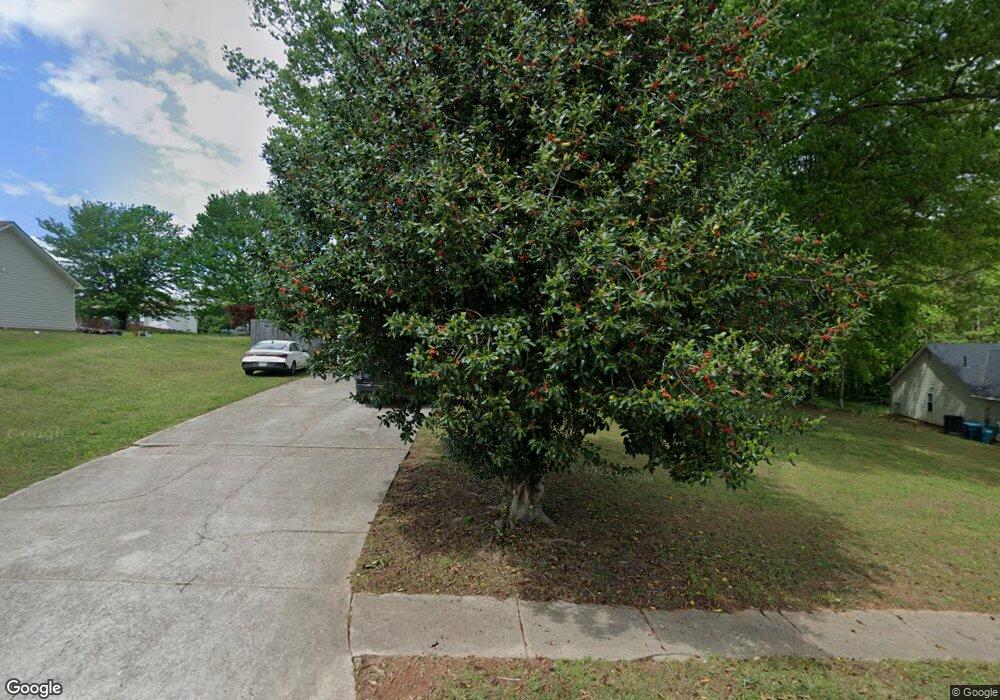
221 Fern Ct Hampton, GA 30228
Estimated Value: $286,000 - $301,411
3
Beds
2
Baths
1,785
Sq Ft
$164/Sq Ft
Est. Value
About This Home
This home is located at 221 Fern Ct, Hampton, GA 30228 and is currently estimated at $292,353, approximately $163 per square foot. 221 Fern Ct is a home located in Henry County with nearby schools including Rocky Creek Elementary School, Hampton Middle School, and Hampton High School.
Ownership History
Date
Name
Owned For
Owner Type
Purchase Details
Closed on
Nov 15, 2019
Sold by
Busby Bobbie
Bought by
Ainsworth John and Ainsworth Kimberly
Current Estimated Value
Home Financials for this Owner
Home Financials are based on the most recent Mortgage that was taken out on this home.
Original Mortgage
$95,000
Outstanding Balance
$82,985
Interest Rate
3.6%
Mortgage Type
New Conventional
Estimated Equity
$209,368
Purchase Details
Closed on
Aug 29, 2011
Sold by
Homesales Inc
Bought by
Busby Bobbie
Home Financials for this Owner
Home Financials are based on the most recent Mortgage that was taken out on this home.
Original Mortgage
$76,800
Interest Rate
4.55%
Mortgage Type
New Conventional
Purchase Details
Closed on
Dec 7, 2010
Sold by
Tuck Leonard B and Tuck Anna M
Bought by
Homesales Inc
Purchase Details
Closed on
Apr 18, 1997
Sold by
Dmd Assoc
Bought by
Tuck Leonard B and Tuck Anna M
Home Financials for this Owner
Home Financials are based on the most recent Mortgage that was taken out on this home.
Original Mortgage
$98,879
Interest Rate
7.85%
Mortgage Type
New Conventional
Create a Home Valuation Report for This Property
The Home Valuation Report is an in-depth analysis detailing your home's value as well as a comparison with similar homes in the area
Home Values in the Area
Average Home Value in this Area
Purchase History
| Date | Buyer | Sale Price | Title Company |
|---|---|---|---|
| Ainsworth John | $100,000 | -- | |
| Busby Bobbie | $40,000 | -- | |
| Homesales Inc | $87,426 | -- | |
| Tuck Leonard B | $98,900 | -- |
Source: Public Records
Mortgage History
| Date | Status | Borrower | Loan Amount |
|---|---|---|---|
| Open | Ainsworth John | $95,000 | |
| Previous Owner | Busby Bobbie | $76,800 | |
| Previous Owner | Tuck Leonard B | $98,879 |
Source: Public Records
Tax History Compared to Growth
Tax History
| Year | Tax Paid | Tax Assessment Tax Assessment Total Assessment is a certain percentage of the fair market value that is determined by local assessors to be the total taxable value of land and additions on the property. | Land | Improvement |
|---|---|---|---|---|
| 2025 | $3,741 | $117,360 | $12,000 | $105,360 |
| 2024 | $3,741 | $125,320 | $12,000 | $113,320 |
| 2023 | $3,137 | $112,720 | $10,000 | $102,720 |
| 2022 | $3,069 | $87,280 | $10,000 | $77,280 |
| 2021 | $2,413 | $75,880 | $10,000 | $65,880 |
| 2020 | $2,475 | $68,360 | $10,000 | $58,360 |
| 2019 | $235 | $53,800 | $8,000 | $45,800 |
| 2018 | $232 | $49,360 | $8,000 | $41,360 |
| 2016 | $234 | $40,920 | $6,000 | $34,920 |
| 2015 | $259 | $35,480 | $6,000 | $29,480 |
| 2014 | $211 | $29,760 | $6,000 | $23,760 |
Source: Public Records
Map
Nearby Homes
- 248 Fern Ct
- 2040 Elm Grove Ln
- 53 Elm St
- 2012 Elm Grove Ln
- 31 Elm St
- 21 Elm St
- 1904 Elm Park Dr
- 220 Windpher Ridge
- 120 Bridgemill Dr
- 325 Peachtree Cir
- 19 Mcdonough St
- 252 Sandstone Dr
- 260 Sandstone Dr
- 32 Mcdonough St
- Ashley 24 Plan at Glenmaye
- Dennis Plan at Glenmaye
- Ashley Plan at Glenmaye
- Hayden Plan at Glenmaye
- Somerset Plan at Glenmaye
- Ashley 22 Plan at Glenmaye