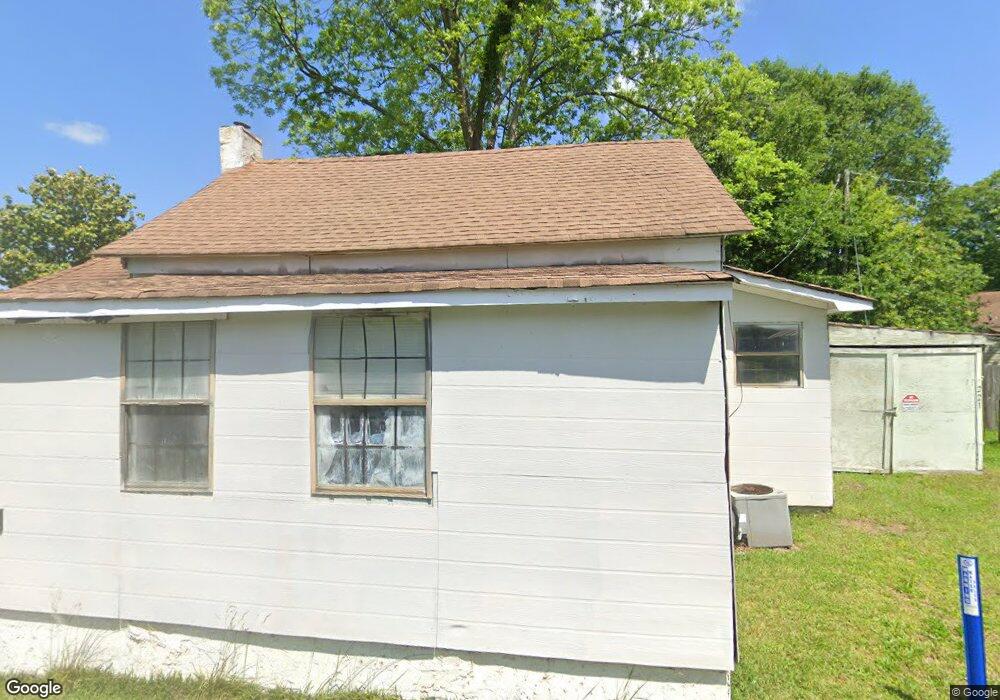
221 Pulliam Dr Jackson, GA 30233
Estimated Value: $86,000 - $129,000
2
Beds
2
Baths
1,014
Sq Ft
$110/Sq Ft
Est. Value
About This Home
This home is located at 221 Pulliam Dr, Jackson, GA 30233 and is currently estimated at $111,340, approximately $109 per square foot. 221 Pulliam Dr is a home located in Butts County with nearby schools including Jackson High School.
Ownership History
Date
Name
Owned For
Owner Type
Purchase Details
Closed on
Mar 11, 2020
Sold by
Crabtree Kelly Brian
Bought by
Crabtree Billy M
Current Estimated Value
Home Financials for this Owner
Home Financials are based on the most recent Mortgage that was taken out on this home.
Original Mortgage
$31,500
Outstanding Balance
$16,083
Interest Rate
3.4%
Mortgage Type
New Conventional
Estimated Equity
$95,257
Purchase Details
Closed on
Sep 11, 2015
Sold by
Crabtree Kelly Brian
Bought by
Crabtree Kelly Brian and Crabtree Christina E
Home Financials for this Owner
Home Financials are based on the most recent Mortgage that was taken out on this home.
Original Mortgage
$25,100
Interest Rate
3.63%
Mortgage Type
New Conventional
Purchase Details
Closed on
Oct 2, 2009
Sold by
Hill Raymond L
Bought by
Crabtree Kelly Brian
Home Financials for this Owner
Home Financials are based on the most recent Mortgage that was taken out on this home.
Original Mortgage
$23,000
Interest Rate
5.05%
Mortgage Type
New Conventional
Create a Home Valuation Report for This Property
The Home Valuation Report is an in-depth analysis detailing your home's value as well as a comparison with similar homes in the area
Home Values in the Area
Average Home Value in this Area
Purchase History
| Date | Buyer | Sale Price | Title Company |
|---|---|---|---|
| Crabtree Billy M | $35,000 | -- | |
| Crabtree Kelly Brian | -- | -- | |
| Crabtree Kelly Brian | $24,900 | -- |
Source: Public Records
Mortgage History
| Date | Status | Borrower | Loan Amount |
|---|---|---|---|
| Open | Crabtree Billy M | $31,500 | |
| Previous Owner | Crabtree Kelly Brian | $25,100 | |
| Previous Owner | Crabtree Kelly Brian | $23,000 |
Source: Public Records
Tax History
| Year | Tax Paid | Tax Assessment Tax Assessment Total Assessment is a certain percentage of the fair market value that is determined by local assessors to be the total taxable value of land and additions on the property. | Land | Improvement |
|---|---|---|---|---|
| 2025 | $831 | $38,231 | $4,000 | $34,231 |
| 2024 | $831 | $38,231 | $4,000 | $34,231 |
| 2023 | $433 | $17,960 | $4,000 | $13,960 |
| 2022 | $269 | $11,898 | $4,000 | $7,898 |
| 2021 | $281 | $11,666 | $4,000 | $7,666 |
| 2020 | $346 | $11,455 | $4,000 | $7,455 |
| 2019 | $219 | $7,521 | $4,000 | $3,521 |
| 2018 | $221 | $7,260 | $4,000 | $3,260 |
| 2017 | $287 | $9,262 | $3,527 | $5,735 |
| 2016 | $231 | $9,262 | $3,527 | $5,735 |
| 2015 | $229 | $9,262 | $3,527 | $5,735 |
| 2014 | $230 | $8,887 | $3,527 | $5,360 |
Source: Public Records
Map
Nearby Homes
- 347 Ww Carr Ave
- 1375 Highway 42 S
- 124 Harper St
- 14 Weaver St
- 321 Kirts Ridge
- 1262 E Highway 16
- 544 Franklin St
- 514 Covington St
- 415 White Pine Dr
- 266 Regal Rd
- 771 Regal Rd
- 0 Highway 36 E Unit 25704971
- 0 E Highway 36 Unit 10693968
- 0 E Highway 36 Unit 10652570
- 0 E Hwy 36 Unit 10611807
- 0 E Highway 36 Unit 7728846
- 193 Brownlee Rd
- 243 Glenn St
- 330 James Moore Cir
- 286 White Elm Ln Unit LOT 184
- 120 Jackson St
- 226 Pulliam Dr
- 9 Jackson St
- 109 Armory Creek Lot 86 Unit LOT 86
- 100 Armory Creek Drive Lot 88 Unit LOT 88
- 39A Lot Lot
- 327 Ww Carr Ave
- 105 Armory Creek Dr Lot 87 Unit LOT 87
- 104 Armory Creek Drive Lot 89 Unit LOT 89
- 178 Jackson St
- 304 Wheeler Creek Lane Lot 91 Unit LOT 91
- 196 Jackson St
- 313 Ww Carr Ave
- 367 Ww Carr Ave
- 105 School St Unit B
- 105 School St Unit A
- 105 School St
- 0 Landing Ct Unit 6 8139633
- 0 Landing Ct Unit 5 8139622
- 0 Landing Ct Unit 7610780
Your Personal Tour Guide
Ask me questions while you tour the home.