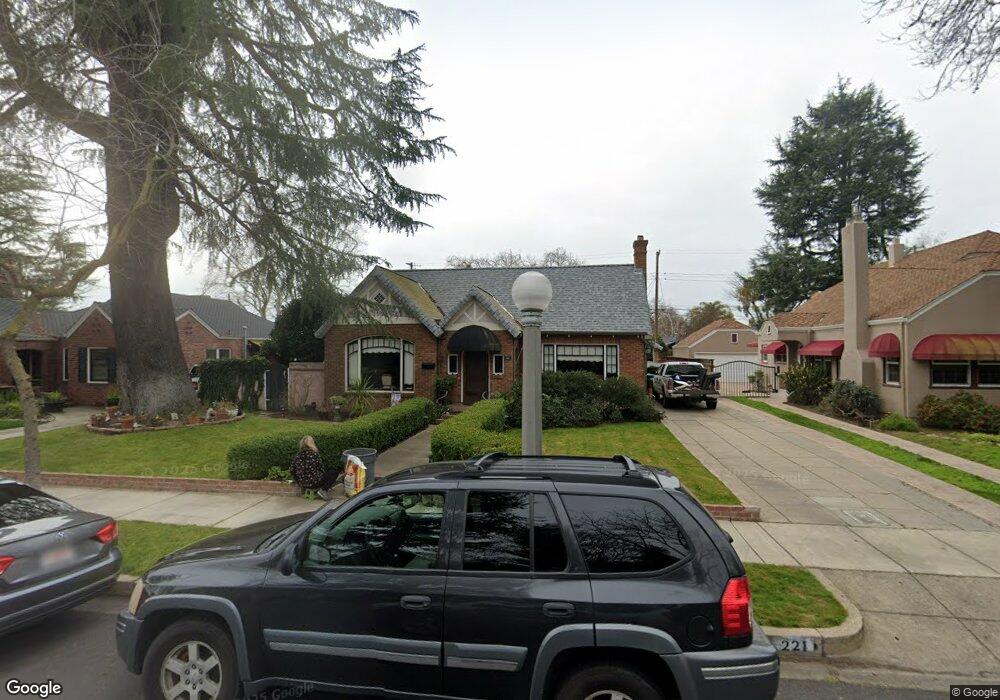
221 S Crescent Ave Lodi, CA 95240
Downtown Lodi NeighborhoodEstimated Value: $431,000 - $714,000
2
Beds
2
Baths
1,927
Sq Ft
$303/Sq Ft
Est. Value
About This Home
This home is located at 221 S Crescent Ave, Lodi, CA 95240 and is currently estimated at $584,637, approximately $303 per square foot. 221 S Crescent Ave is a home located in San Joaquin County with nearby schools including George Washington Elementary School, Millswood Middle School, and Lodi High School.
Ownership History
Date
Name
Owned For
Owner Type
Purchase Details
Closed on
May 14, 2003
Sold by
Sisneros Thomas E and Sisneros Brodie
Bought by
Wuest Bruce A and Wuest Carolyn M
Current Estimated Value
Home Financials for this Owner
Home Financials are based on the most recent Mortgage that was taken out on this home.
Original Mortgage
$275,000
Outstanding Balance
$118,824
Interest Rate
5.71%
Mortgage Type
Purchase Money Mortgage
Estimated Equity
$465,813
Purchase Details
Closed on
Jul 28, 1999
Sold by
Kirst Morris E & Dorothy E Tr and The Kirst Family Trust
Bought by
Sisneros Thomas E and Sisneros Brodie
Home Financials for this Owner
Home Financials are based on the most recent Mortgage that was taken out on this home.
Original Mortgage
$195,691
Interest Rate
7.64%
Mortgage Type
FHA
Purchase Details
Closed on
Jan 30, 1998
Sold by
Kirst Elmer C Trust and Eugene Morris
Bought by
Kirst Morris Eugene and Kirst Dorothy Evelyn
Create a Home Valuation Report for This Property
The Home Valuation Report is an in-depth analysis detailing your home's value as well as a comparison with similar homes in the area
Home Values in the Area
Average Home Value in this Area
Purchase History
| Date | Buyer | Sale Price | Title Company |
|---|---|---|---|
| Wuest Bruce A | $368,000 | Chicago Title Co | |
| Sisneros Thomas E | $197,000 | Alliance Title Company | |
| Kirst Morris Eugene | -- | -- |
Source: Public Records
Mortgage History
| Date | Status | Borrower | Loan Amount |
|---|---|---|---|
| Open | Wuest Bruce A | $275,000 | |
| Previous Owner | Sisneros Thomas E | $195,691 |
Source: Public Records
Tax History Compared to Growth
Tax History
| Year | Tax Paid | Tax Assessment Tax Assessment Total Assessment is a certain percentage of the fair market value that is determined by local assessors to be the total taxable value of land and additions on the property. | Land | Improvement |
|---|---|---|---|---|
| 2025 | $5,469 | $510,640 | $144,820 | $365,820 |
| 2024 | $5,318 | $500,629 | $141,981 | $358,648 |
| 2023 | $5,245 | $490,814 | $139,198 | $351,616 |
| 2022 | $5,127 | $481,191 | $136,469 | $344,722 |
| 2021 | $5,219 | $471,757 | $133,794 | $337,963 |
| 2020 | $5,082 | $466,921 | $132,423 | $334,498 |
| 2019 | $4,978 | $457,767 | $129,827 | $327,940 |
| 2018 | $4,907 | $448,792 | $127,282 | $321,510 |
| 2017 | $4,796 | $439,993 | $124,787 | $315,206 |
| 2016 | $4,111 | $395,000 | $112,000 | $283,000 |
| 2014 | $3,039 | $290,400 | $86,900 | $203,500 |
Source: Public Records
Map
Nearby Homes
- 430 S Crescent Ave
- 542 Sturla St
- 607 S Crescent Ave
- 912 Tara Place
- 619 W Elm St
- 380 S Sunset Dr
- 613 S Lee Ave
- 317 Church St
- 431 W Elm St
- 709 S Lee Ave
- 503 Saint Claire Dr
- 805 S Crescent Ave
- 411 W Locust St
- 725 Costa Dr
- 530 S School St
- 303 W Lockeford St
- 400 N Fairmont Ave
- 800 Cheney Ct
- 419 Matthew Plaza
- 407 N Pleasant Ave
- 215 S Crescent Ave
- 225 S Crescent Ave
- 211 S Crescent Ave
- 220 S Avena Ave
- 216 S Avena Ave
- 224 S Avena Ave
- 212 S Avena Ave
- 831 W Lodi Ave
- 205 S Crescent Ave
- 810 W Walnut St
- 220 S Crescent Ave
- 224 S Crescent Ave
- 210 S Avena Ave
- 212 S Crescent Ave
- 228 S Crescent Ave
- 210 S Crescent Ave
- 234 S Crescent Ave
- 820 W Walnut St
- 720 W Walnut St
- 800 W Lodi Ave