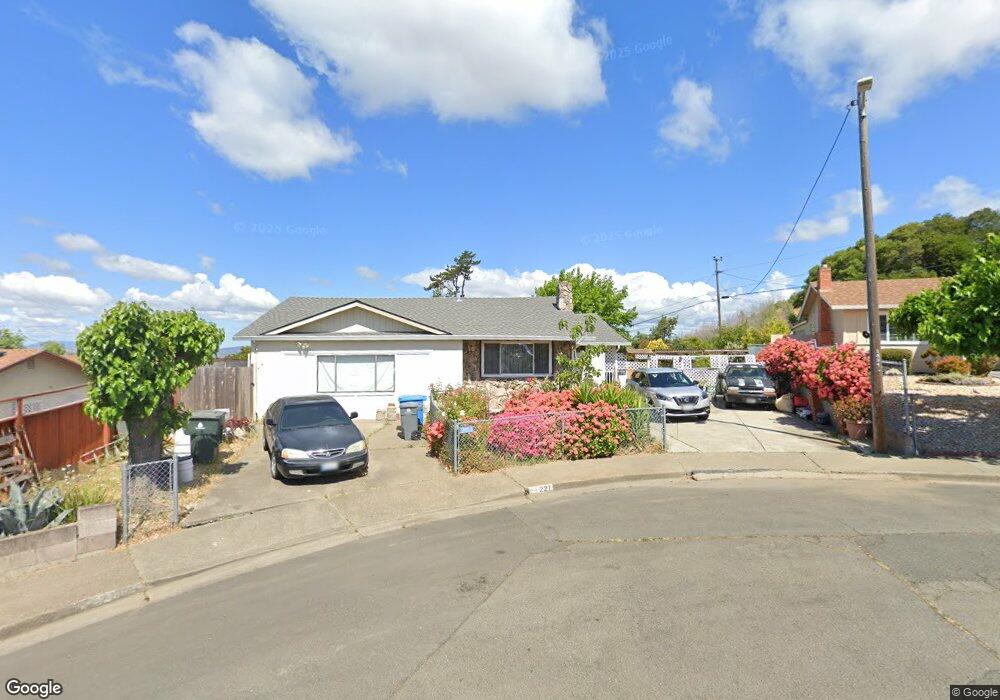
221 Swan Way Vallejo, CA 94589
North Vallejo NeighborhoodEstimated Value: $440,000 - $543,642
3
Beds
2
Baths
1,544
Sq Ft
$325/Sq Ft
Est. Value
About This Home
This home is located at 221 Swan Way, Vallejo, CA 94589 and is currently estimated at $501,161, approximately $324 per square foot. 221 Swan Way is a home located in Solano County with nearby schools including Elsa Widenmann Elementary, Solano Middle School, and Vallejo High School.
Ownership History
Date
Name
Owned For
Owner Type
Purchase Details
Closed on
Dec 11, 2015
Sold by
Santos Julita T and Jackson Joel
Bought by
Santos Julita T and Jackson Joel
Current Estimated Value
Home Financials for this Owner
Home Financials are based on the most recent Mortgage that was taken out on this home.
Original Mortgage
$193,000
Outstanding Balance
$152,426
Interest Rate
3.83%
Mortgage Type
New Conventional
Estimated Equity
$348,735
Purchase Details
Closed on
Aug 5, 1994
Sold by
Juan Amador S and Juan Remedios V
Bought by
Jackson Joel and Santos Vincente E
Home Financials for this Owner
Home Financials are based on the most recent Mortgage that was taken out on this home.
Original Mortgage
$129,141
Interest Rate
8.65%
Mortgage Type
FHA
Create a Home Valuation Report for This Property
The Home Valuation Report is an in-depth analysis detailing your home's value as well as a comparison with similar homes in the area
Home Values in the Area
Average Home Value in this Area
Purchase History
| Date | Buyer | Sale Price | Title Company |
|---|---|---|---|
| Santos Julita T | -- | Old Republic Title Company | |
| Jackson Joel | $130,000 | North American Title Company |
Source: Public Records
Mortgage History
| Date | Status | Borrower | Loan Amount |
|---|---|---|---|
| Open | Santos Julita T | $193,000 | |
| Previous Owner | Jackson Joel | $129,141 |
Source: Public Records
Tax History Compared to Growth
Tax History
| Year | Tax Paid | Tax Assessment Tax Assessment Total Assessment is a certain percentage of the fair market value that is determined by local assessors to be the total taxable value of land and additions on the property. | Land | Improvement |
|---|---|---|---|---|
| 2025 | $3,565 | $218,354 | $58,787 | $159,567 |
| 2024 | $3,565 | $214,074 | $57,635 | $156,439 |
| 2023 | $3,339 | $209,877 | $56,505 | $153,372 |
| 2022 | $3,239 | $205,763 | $55,398 | $150,365 |
| 2021 | $3,167 | $201,729 | $54,312 | $147,417 |
| 2020 | $3,171 | $199,662 | $53,756 | $145,906 |
| 2019 | $4,837 | $195,748 | $52,702 | $143,046 |
| 2018 | $2,865 | $191,911 | $51,669 | $140,242 |
| 2017 | $2,728 | $188,149 | $50,656 | $137,493 |
| 2016 | $2,146 | $184,461 | $49,663 | $134,798 |
| 2015 | $2,118 | $181,692 | $48,918 | $132,774 |
| 2014 | $2,089 | $178,134 | $47,960 | $130,174 |
Source: Public Records
Map
Nearby Homes
- 345 Swan Way
- 201 Redwing St
- 124 Purdue Dr
- 200 Fieldstone Ct
- 106 Fieldstone Way
- 139 Marquette Ave
- 484 Corcoran Ave Unit 2
- 102 Dartmouth Ave
- 444 Corcoran Ave Unit 4
- 203 Baylor Dr Unit 11
- 240 Rinaldo Dr
- 420 Corcoran Ave Unit 4
- 2041 Severus Dr
- 205 Marla Dr
- 111 Spencer St
- 706 Capra Dr
- 420 Sandstone Dr
- 337 Falcon Dr
- 2525 Flosden Rd Unit 61
- 9 Kevin Ln