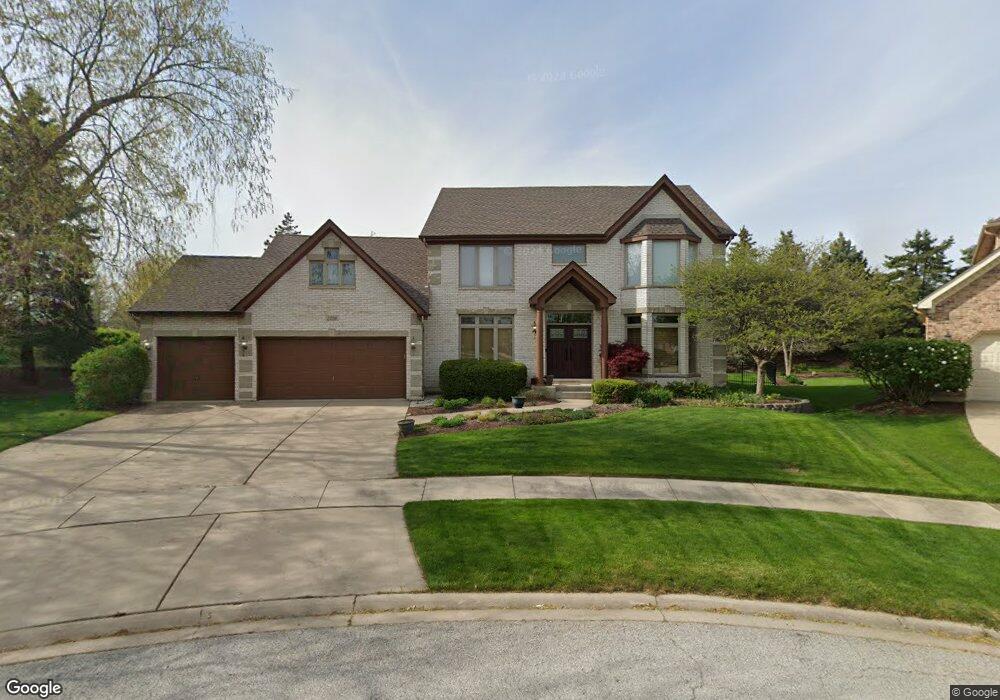
2210 Kenyon Ct Unit 45 Aurora, IL 60502
Eola Yards NeighborhoodEstimated Value: $649,000 - $796,000
4
Beds
3
Baths
3,311
Sq Ft
$219/Sq Ft
Est. Value
About This Home
This home is located at 2210 Kenyon Ct Unit 45, Aurora, IL 60502 and is currently estimated at $723,924, approximately $218 per square foot. 2210 Kenyon Ct Unit 45 is a home located in DuPage County with nearby schools including Gwendolyn Brooks Elementary School, Francis Granger Middle School, and Metea Valley High School.
Ownership History
Date
Name
Owned For
Owner Type
Purchase Details
Closed on
Jun 25, 2004
Sold by
Levine Martin and Levine Hollis
Bought by
Doiron Timothy J and Doiron Jill A
Current Estimated Value
Home Financials for this Owner
Home Financials are based on the most recent Mortgage that was taken out on this home.
Original Mortgage
$280,000
Outstanding Balance
$141,254
Interest Rate
6.37%
Mortgage Type
Purchase Money Mortgage
Estimated Equity
$582,670
Purchase Details
Closed on
Mar 28, 1997
Sold by
Levine Martin E and Levine Hollis D
Bought by
Levine Martin and Levine Hollis
Purchase Details
Closed on
May 3, 1994
Sold by
Kacak Development Inc
Bought by
Levine Martin E and Levine Hollis D
Home Financials for this Owner
Home Financials are based on the most recent Mortgage that was taken out on this home.
Original Mortgage
$225,000
Interest Rate
8.08%
Create a Home Valuation Report for This Property
The Home Valuation Report is an in-depth analysis detailing your home's value as well as a comparison with similar homes in the area
Home Values in the Area
Average Home Value in this Area
Purchase History
| Date | Buyer | Sale Price | Title Company |
|---|---|---|---|
| Doiron Timothy J | $480,000 | Git | |
| Levine Martin | -- | -- | |
| Levine Martin E | $286,000 | -- |
Source: Public Records
Mortgage History
| Date | Status | Borrower | Loan Amount |
|---|---|---|---|
| Open | Doiron Timothy J | $280,000 | |
| Previous Owner | Levine Martin E | $225,000 |
Source: Public Records
Tax History
| Year | Tax Paid | Tax Assessment Tax Assessment Total Assessment is a certain percentage of the fair market value that is determined by local assessors to be the total taxable value of land and additions on the property. | Land | Improvement |
|---|---|---|---|---|
| 2024 | $14,054 | $192,832 | $54,788 | $138,044 |
| 2023 | $13,431 | $173,270 | $49,230 | $124,040 |
| 2022 | $12,675 | $157,150 | $44,300 | $112,850 |
| 2021 | $12,347 | $151,540 | $42,720 | $108,820 |
| 2020 | $12,497 | $151,540 | $42,720 | $108,820 |
| 2019 | $12,067 | $144,130 | $40,630 | $103,500 |
| 2018 | $12,656 | $149,290 | $42,390 | $106,900 |
| 2017 | $12,454 | $144,220 | $40,950 | $103,270 |
| 2016 | $12,243 | $138,410 | $39,300 | $99,110 |
| 2015 | $12,131 | $131,410 | $37,310 | $94,100 |
| 2014 | $12,743 | $133,900 | $37,730 | $96,170 |
| 2013 | $12,610 | $134,830 | $37,990 | $96,840 |
Source: Public Records
Map
Nearby Homes
- 2752 Preserve Cir Unit 13006
- 2748 Preserve Cir Unit 13005
- 2732 Preserve Cir Unit 13001
- 2892 Preserve Cir Unit 5003
- 1151 Barkston Ln
- 1104 Heathrow Ln
- 1740 Stable Ln
- 970 Waterside Ct
- 1780 Briarheath Dr
- 1771 Briarheath Dr
- 1167 Kingsley Ln
- 2428 Ridgewood Ct
- 1660 Briarheath Dr
- 940 Burnham Ct
- 1283 Cranbrook Cir Unit 38
- 2505 Brookstone Ct
- 1671 Sheffer Rd
- 2783 Palm Springs Ln
- 1110 Oakhill Dr
- 1223 Townes Cir Unit 48
- 2222 Kenyon Ct
- 2229 Kenyon Ct
- 1191 Barkston Ct
- 2234 Kenyon Ct
- 1193 Barkston Ct
- 1189 Barkston Ct
- 2246 Kenyon Ct
- 2239 Kenyon Ct
- 1195 Barkston Ct
- 2258 Kenyon Ct
- 1185 Barkston Ct
- 1170 Biscay Ct
- 2110 Brookside Ln
- 1160 Biscay Ct
- 1183 Barkston Ct
- 2118 Brookside Ln
- 1197 Barkston Ct
- 1150 Biscay Ct
- 2155 Highbury Ln
- 1192 Barkston Ct
Your Personal Tour Guide
Ask me questions while you tour the home.