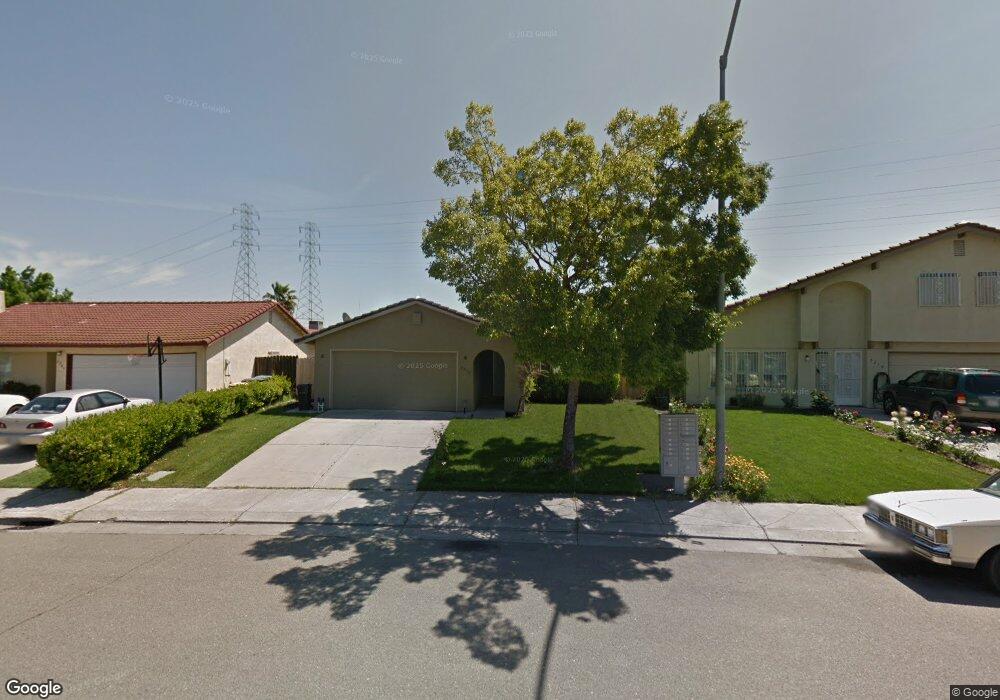
2210 Port Trinity Cir Stockton, CA 95206
Seaport NeighborhoodEstimated Value: $383,184 - $405,000
3
Beds
2
Baths
1,259
Sq Ft
$313/Sq Ft
Est. Value
About This Home
This home is located at 2210 Port Trinity Cir, Stockton, CA 95206 and is currently estimated at $394,092, approximately $313 per square foot. 2210 Port Trinity Cir is a home located in San Joaquin County with nearby schools including Taylor Leadership Academy, John Marshall Elementary School, and San Joaquin Elementary School.
Ownership History
Date
Name
Owned For
Owner Type
Purchase Details
Closed on
Dec 29, 2011
Sold by
Gann Properties Lp
Bought by
Ernas Lunie M
Current Estimated Value
Home Financials for this Owner
Home Financials are based on the most recent Mortgage that was taken out on this home.
Original Mortgage
$112,084
Outstanding Balance
$78,260
Interest Rate
4.37%
Mortgage Type
FHA
Estimated Equity
$315,832
Purchase Details
Closed on
Aug 11, 2011
Sold by
Fernandez Englebert and Fernandez Menachem
Bought by
Gann Properties Lp
Purchase Details
Closed on
Dec 8, 2000
Sold by
Castro Ramon and Castro E
Bought by
Fernandez Engelbert and Fernandez Menachem
Home Financials for this Owner
Home Financials are based on the most recent Mortgage that was taken out on this home.
Original Mortgage
$119,716
Interest Rate
7.67%
Mortgage Type
FHA
Create a Home Valuation Report for This Property
The Home Valuation Report is an in-depth analysis detailing your home's value as well as a comparison with similar homes in the area
Home Values in the Area
Average Home Value in this Area
Purchase History
| Date | Buyer | Sale Price | Title Company |
|---|---|---|---|
| Ernas Lunie M | $115,000 | Old Republic Title Company | |
| Gann Properties Lp | $55,700 | Old Republic Title Company | |
| Fernandez Engelbert | $120,000 | Old Republic Title Company |
Source: Public Records
Mortgage History
| Date | Status | Borrower | Loan Amount |
|---|---|---|---|
| Open | Ernas Lunie M | $112,084 | |
| Previous Owner | Fernandez Engelbert | $119,716 |
Source: Public Records
Tax History Compared to Growth
Tax History
| Year | Tax Paid | Tax Assessment Tax Assessment Total Assessment is a certain percentage of the fair market value that is determined by local assessors to be the total taxable value of land and additions on the property. | Land | Improvement |
|---|---|---|---|---|
| 2025 | $1,972 | $144,439 | $35,166 | $109,273 |
| 2024 | $1,940 | $141,608 | $34,477 | $107,131 |
| 2023 | $1,896 | $138,832 | $33,801 | $105,031 |
| 2022 | $1,754 | $136,111 | $33,139 | $102,972 |
| 2021 | $1,692 | $133,443 | $32,490 | $100,953 |
| 2020 | $1,723 | $132,075 | $32,157 | $99,918 |
| 2019 | $1,717 | $129,486 | $31,527 | $97,959 |
| 2018 | $1,686 | $126,948 | $30,909 | $96,039 |
| 2017 | $1,600 | $124,459 | $30,303 | $94,156 |
| 2016 | $1,628 | $122,019 | $29,709 | $92,310 |
| 2014 | $1,552 | $117,833 | $28,690 | $89,143 |
Source: Public Records
Map
Nearby Homes
- 2353 Georgia Ave
- 1328 Luna Ln
- 1409 Laguna Cir
- 1232 Denver Ave
- 544 W 9th St
- 426 Howard St
- 407 W 7th St
- 1425 Silverbell Dr
- 364 W 7th St
- 2510 S Harrison St
- 1932 S Lincoln St
- 220 Delhi Ave
- 314 Kolher St
- 2128 Green River Ln
- 2650 S Fresno Ave
- 3228 Fairmont Ave
- 520 W Jackson St
- 174 Horton Ave
- 416 W Jackson St
- 3330 Konig Ct
- 2206 Port Trinity Cir
- 2214 Port Trinity Cir
- 2218 Port Trinity Cir
- 844 W 8th St
- 856 W 8th St
- 2222 Port Trinity Cir
- 820 W 8th St
- 2215 Port Trinity Cir
- 2207 Port Trinity Cir
- 914 W 8th St
- 2219 Port Trinity Cir
- 2303 Georgia Ave
- 2226 Port Trinity Cir
- 2243 Georgia Ave
- 2313 Georgia Ave
- 2233 Georgia Ave
- 2223 Port Trinity Cir
- 926 W 8th St
- 2323 Georgia Ave
- 2223 Georgia Ave