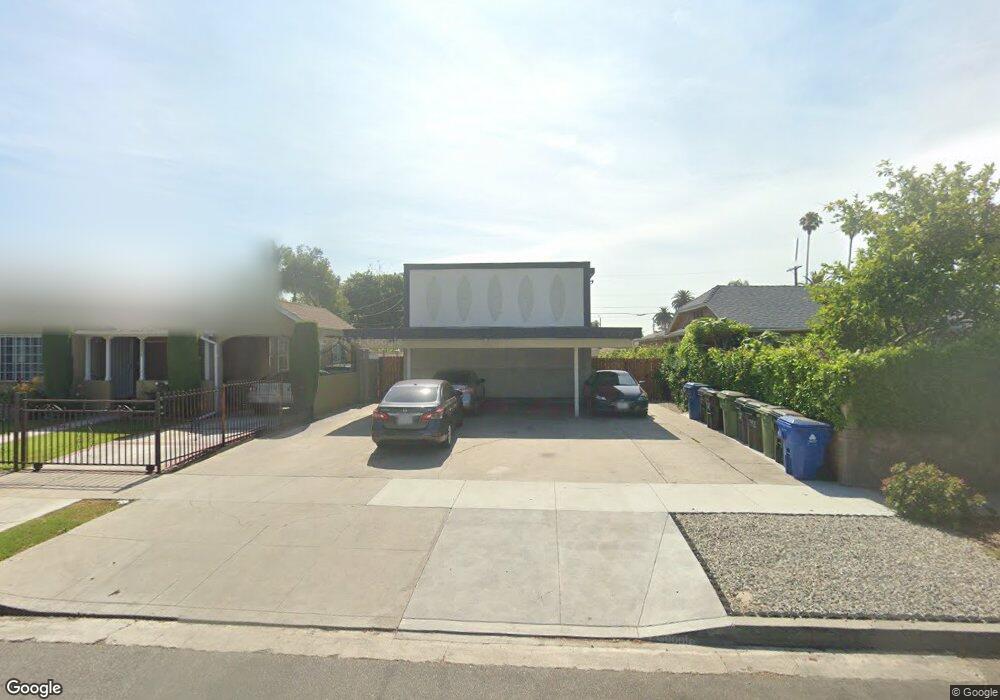
2210 S Sycamore Ave Unit 1 Los Angeles, CA 90016
Mid-City NeighborhoodEstimated Value: $1,099,000 - $1,548,000
2
Beds
1
Bath
900
Sq Ft
$1,455/Sq Ft
Est. Value
About This Home
This home is located at 2210 S Sycamore Ave Unit 1, Los Angeles, CA 90016 and is currently estimated at $1,309,590, approximately $1,455 per square foot. 2210 S Sycamore Ave Unit 1 is a home located in Los Angeles County with nearby schools including Cienega Elementary School, Johnnie L. Cochran Jr. Middle School, and Susan Miller Dorsey Senior High School.
Ownership History
Date
Name
Owned For
Owner Type
Purchase Details
Closed on
Jan 6, 2020
Sold by
Dini Llc
Bought by
Wilson Iman
Current Estimated Value
Home Financials for this Owner
Home Financials are based on the most recent Mortgage that was taken out on this home.
Original Mortgage
$861,600
Outstanding Balance
$759,624
Interest Rate
3.6%
Mortgage Type
New Conventional
Estimated Equity
$549,966
Purchase Details
Closed on
Mar 13, 2013
Sold by
Holland Erik and Holland Charlene
Bought by
Dini Llc
Purchase Details
Closed on
Jun 21, 2001
Sold by
Stalling James L
Bought by
Holland Erik
Home Financials for this Owner
Home Financials are based on the most recent Mortgage that was taken out on this home.
Original Mortgage
$290,442
Interest Rate
7.09%
Mortgage Type
FHA
Create a Home Valuation Report for This Property
The Home Valuation Report is an in-depth analysis detailing your home's value as well as a comparison with similar homes in the area
Home Values in the Area
Average Home Value in this Area
Purchase History
| Date | Buyer | Sale Price | Title Company |
|---|---|---|---|
| Wilson Iman | $1,077,000 | Chicago Title Company | |
| Dini Llc | $520,000 | Chicago Title Company | |
| Holland Erik | $295,000 | Gateway Title Company |
Source: Public Records
Mortgage History
| Date | Status | Borrower | Loan Amount |
|---|---|---|---|
| Open | Wilson Iman | $861,600 | |
| Previous Owner | Holland Erik | $290,442 |
Source: Public Records
Tax History Compared to Growth
Tax History
| Year | Tax Paid | Tax Assessment Tax Assessment Total Assessment is a certain percentage of the fair market value that is determined by local assessors to be the total taxable value of land and additions on the property. | Land | Improvement |
|---|---|---|---|---|
| 2025 | $14,279 | $1,177,853 | $472,453 | $705,400 |
| 2024 | $14,279 | $1,154,759 | $463,190 | $691,569 |
| 2023 | $14,008 | $1,132,117 | $454,108 | $678,009 |
| 2022 | $13,365 | $1,109,919 | $445,204 | $664,715 |
| 2021 | $13,270 | $1,088,157 | $436,475 | $651,682 |
| 2020 | $7,504 | $585,504 | $416,610 | $168,894 |
| 2019 | $7,219 | $574,025 | $408,442 | $165,583 |
| 2018 | $7,111 | $562,771 | $400,434 | $162,337 |
| 2016 | $6,777 | $540,920 | $384,886 | $156,034 |
| 2015 | $6,681 | $532,796 | $379,105 | $153,691 |
| 2014 | $6,727 | $522,360 | $371,679 | $150,681 |
Source: Public Records
Map
Nearby Homes
- 2235 S Mansfield Ave
- 2230 S Redondo Blvd
- 2115 S Mansfield Ave
- 5144 W 21st St
- 5047 W 21st St
- 2116 S Cloverdale Ave
- 5154 W 20th St
- 2133 Cloverdale Ave
- 2308 S Highland Ave
- 2332 S Highland Ave
- 2231 S Longwood Ave
- 2342 S Cochran Ave
- 4935 W 20th St
- 2524 Alsace Ave
- 2404 S Cochran Ave
- 5227 W 20th St
- 2406 S Cochran Ave
- 2151 S West View St
- 1858 S Orange Dr
- 2430 S Cochran Ave
- 2210 S Sycamore Ave Unit 3
- 2210 S Sycamore Ave
- 2206 S Sycamore Ave
- 2216 S Sycamore Ave
- 2200 S Sycamore Ave
- 2220 S Sycamore Ave
- 2156 S Sycamore Ave
- 2224 S Sycamore Ave
- 2223 S Orange Dr
- 2219 S Orange Dr
- 2229 S Orange Dr
- 2215 S Orange Dr
- 2233 S Orange Dr
- 2228 S Sycamore Ave
- 2152 S Sycamore Ave
- 2207 S Sycamore Ave
- 2211 S Sycamore Ave
- 2211 S Orange Dr
- 2301 S Orange Dr
- 2203 S Sycamore Ave