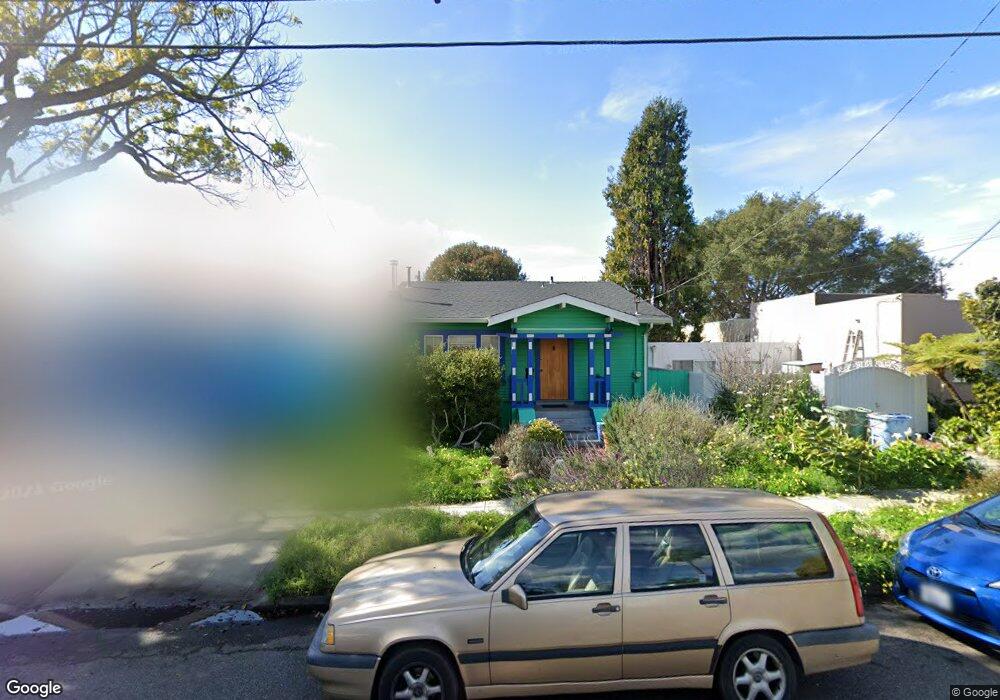
2210 Spaulding Ave Berkeley, CA 94703
Downtown Berkeley NeighborhoodEstimated Value: $1,131,000 - $1,305,000
2
Beds
1
Bath
1,040
Sq Ft
$1,138/Sq Ft
Est. Value
About This Home
This home is located at 2210 Spaulding Ave, Berkeley, CA 94703 and is currently estimated at $1,183,652, approximately $1,138 per square foot. 2210 Spaulding Ave is a home located in Alameda County with nearby schools including Washington Elementary School, Oxford Elementary School, and Berkeley Arts Magnet at Whittier School.
Ownership History
Date
Name
Owned For
Owner Type
Purchase Details
Closed on
Dec 17, 2002
Sold by
Boltz Brett Allison and Boltz Brett
Bought by
Boltz Brett Allison
Current Estimated Value
Home Financials for this Owner
Home Financials are based on the most recent Mortgage that was taken out on this home.
Original Mortgage
$147,500
Outstanding Balance
$62,081
Interest Rate
5.96%
Estimated Equity
$1,121,571
Purchase Details
Closed on
Dec 2, 1996
Sold by
Hungerford Linda R and Boltz Brett A
Bought by
Boltz Brett
Purchase Details
Closed on
Dec 29, 1993
Sold by
Bliss Walter Shepherd
Bought by
Hungerford Linda R and Boltz Brett Allison
Home Financials for this Owner
Home Financials are based on the most recent Mortgage that was taken out on this home.
Original Mortgage
$164,000
Interest Rate
7.38%
Create a Home Valuation Report for This Property
The Home Valuation Report is an in-depth analysis detailing your home's value as well as a comparison with similar homes in the area
Home Values in the Area
Average Home Value in this Area
Purchase History
| Date | Buyer | Sale Price | Title Company |
|---|---|---|---|
| Boltz Brett Allison | -- | Chicago Title Company | |
| Boltz Brett | $8,000 | -- | |
| Hungerford Linda R | $205,000 | Old Republic Title Company |
Source: Public Records
Mortgage History
| Date | Status | Borrower | Loan Amount |
|---|---|---|---|
| Open | Boltz Brett Allison | $147,500 | |
| Closed | Hungerford Linda R | $164,000 |
Source: Public Records
Tax History
| Year | Tax Paid | Tax Assessment Tax Assessment Total Assessment is a certain percentage of the fair market value that is determined by local assessors to be the total taxable value of land and additions on the property. | Land | Improvement |
|---|---|---|---|---|
| 2025 | $6,905 | $338,202 | $102,601 | $242,601 |
| 2024 | $6,905 | $331,433 | $100,589 | $237,844 |
| 2023 | $6,687 | $331,799 | $98,617 | $233,182 |
| 2022 | $6,479 | $318,294 | $96,684 | $228,610 |
| 2021 | $6,472 | $311,916 | $94,788 | $224,128 |
| 2020 | $6,115 | $315,648 | $93,817 | $221,831 |
| 2019 | $5,849 | $309,460 | $91,978 | $217,482 |
| 2018 | $5,723 | $303,394 | $90,175 | $213,219 |
| 2017 | $5,497 | $297,446 | $88,407 | $209,039 |
| 2016 | $5,283 | $291,615 | $86,674 | $204,941 |
| 2015 | $5,198 | $287,236 | $85,372 | $201,864 |
| 2014 | $5,089 | $281,610 | $83,700 | $197,910 |
Source: Public Records
Map
Nearby Homes
- 2118 California St
- 2350 Sacramento St
- 2218 -2222 Grant St
- 1411 Hearst Ave Unit 2
- 1813 Sacramento St
- 1645 Dwight Way
- 1230 Addison St
- 1436 Delaware St
- 2324 Browning St
- 2231 Byron St
- 1261 Hearst Ave
- 1612 Parker St
- 1919 Curtis St
- 1612 Carleton St
- 1144 Dwight Way
- 1142 Dwight Way
- 1515 Derby St
- 1322 Virginia St
- 1118 Dwight Way
- 1039 Channing Way
- 2216 Spaulding Ave
- 1514 Allston Way
- 1512 Allston Way
- 2218 Spaulding Ave
- 2202 Spaulding Ave
- 2220 Spaulding Ave
- 2205 Sacramento St
- 2207 Sacramento St
- 2201 Sacramento St
- 2211 Sacramento St
- 2213 Sacramento St
- 2224 Spaulding Ave
- 2217 Sacramento St
- 2153 Sacramento St
- 2228 Spaulding Ave
- 2219 Sacramento St
- 1515 Allston Way
- 1511 Allston Way
- 1519 Allston Way
- 2149 Sacramento St
Your Personal Tour Guide
Ask me questions while you tour the home.